Illustrative Mathematics
How Much is a Penny Worth?
Are pennies really worth one cent? Here, learners use rates to calculate the price per pound of copper that would result in pennies that are exactly one cent's worth of copper. Might work best as a group or whole-class activity since the...
Curated OER
How Do You Profit From Trading Stocks?
Students calculate gains and losses of stock portfolios. Although the Global Stock Game (GSG) calculates profits and losses automatically, students should learn the basic math skills in calculating their stock investment the...
Curated OER
Turn Up the Volume
Measuring volume can be a mystery for 5th graders, but this hands-on activity gives the gift of discovery. The volume of simple rectangular solids and irregular shapes are calculated through various methods including displacing liquid in...
Curated OER
Simple Probability
Young scholars explore simple probability. Each student spins a spinner and records the result as they enter the room. The recorded results are used to calculate experimental probabilities. After the teacher explains how to calculate...
Curated OER
Climb to Faster Reading
Students participate in repeated reading activities to improve their fluency after listening to the teacher model fluent and non-fluent reading. They work with a partner to complete repeated reading of sentences and books while being...
Curated OER
Nascar Unit Activity 2
Eighth graders divide into groups of 4 or 5. They go to the track and have every student run/walk one lap around the school track. Call out their times as they cross the finish line. In the computer lab, have the students create a table...
Curated OER
How Many Units?
Young mathematicians calculate the area of rectangles and squares. In this geometry lesson, learners are grouped in pairs and use geoboards to construct rectangles. They calculate the area of the figure by counting the number of square...
Curated OER
Investing for the Future
Twelfth graders perform basic calculations for saving and investment strategies. they simulate the investment of $1,000 in the stock market and savings account. they determine which pays the greater dividend.
Curated OER
MicroHike
Students observe insects in a small area. They calculate the number of insects in a large area as well. They share their calculations and observations with the class.
Curated OER
Horatio's Ratios
View a PBS video entitled Horatio's Drive and explore Horatio's Ratios. Collaborative learners form groups to use Mapquest to determine distances covered. They generate the mathematical averages, ratios, and rates in order to calculate...
Curated OER
Trip to the Greenbrier
Tenth graders explore the Greenbriar Resort. In this budgeting lesson, 10th graders plan and calculate the cost of trips from their home to the Greenbriar Resort.
Curated OER
Appalachia: Physical Fitness
Students plan a family fitness outing. In this physical education lesson, students will research possible physical activities which might be completed by a family during a daily-long outing in the Appalachian area. Students will...
Curated OER
Volume of Cylinders
Middle and high schoolers calculate the volume of cylinders. In this geometry lesson, learners differentiate between rectangular prisms and cylinders. They use the correct formula to solve for each solid.
Curated OER
Exploring Circles
High schoolers explore circles using a graphing calculator. For this circles lesson, students write the equation of a circle with a given center and radius length. High schoolers find the most appropriate model for each combination of...
Curated OER
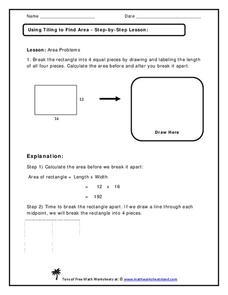
Using Tiling to Find Area
There is only one area calculation problem here, and the explanation is detailed below; consider projecting this as an all-class warm up. Scholars assess a rectangle with given length and width, calculating its area. Next, they break it...
Curated OER
Worksheet 12 - Differentiable Functions
In this differentiable function worksheet, students identify differentiable functions and calculate the derivative of a function. This two-page worksheet contains eight multi-step problems.
Curated OER
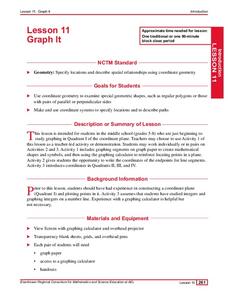
Graph It
Elementary and middle schoolers engage in a lesson of graphing in quadrant I of the coordinate plain. They use the graph to create shapes and symbols. While using a graphing calculator, they locate the points on the coordinate plane. In...
Curated OER
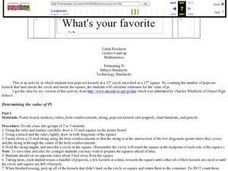
What's your favorite pi?
Sixth graders toss popcorn kernels at a 12? circle inscribed in a 12? square. By counting the number of popcorn kernels that land inside the circle and inside the square the students calculate estimates for the value of pi.
Noyce Foundation
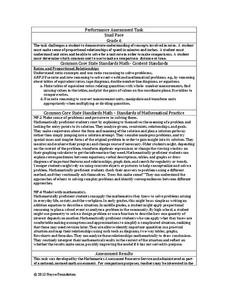
Snail Pace
Slow and steady wins the race? In the assessment task, scholars calculate the rates at which different snails travel in order to find the fastest snail. Hopefully, your class will move much more quickly in finishing the task!
Curated OER
ExplorA-Pond: 4th Grade Perimeter Estimation
Your geometers are used to finding the perimeter of a square or rectangle, so give them something different this time! With this lesson, small groups will receive a picture of a shoreline and calculate the perimeter. The website listed...
Curated OER
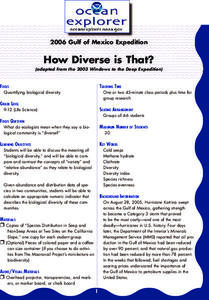
How Diverse is That?
After reviewing biodiversity, learners work in small groups to analyze actual species distribution data. They learn to calculate the Shannon-Weaver diversity index for different communities. Though not particularly engaging, the content...
Curated OER
Computing Indefinite Integrals
Provide your students with a framework for introducing indefinite integrals. It takes into account a learner’s prior knowledge of slope fields and definite integrals and uses the notion of an antiderivative to give them an intuitive...
Curated OER
"Lucky Charms": Interpreting Data and Making Predictions
Seventh graders determine if a "lucky charm" will increase their chances of winning a game. Students calculate the experimental probability of each player in a game. They observe and collect data from each activity. Students compare the...
Curated OER
Capture/Recapture
Students use proportions to estimate the size of populations. They describe the data with using a graph or table of the estimate. Students use descriptive statistics to calculate mean, median, and mode. They also compare and contrast an...
Other popular searches
- Calculating Time Zones
- Calculating Time and Motion
- Calculating Time Lesson
- Calculating Time Manually


