CK-12 Foundation
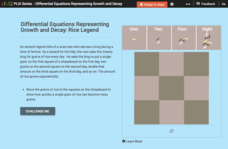
Differential Equations Representing Growth and Decay: Rice Legend
The legend of a wise man who asks a king for rice as a reward presents a context to study exponential solutions to differential equations. Pupils move quantities of rice to a chessboard and calculate the amount of rice for each day. To...
CK-12 Foundation
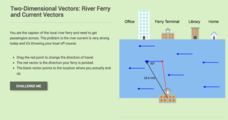
Two-Dimensional Vectors: River Ferry and Current Vectors
Fight against the current. Pupils explore the resulting path when they are crossing a river while being pushed downstream by the current. Using vector notation, learners express the speed and direction of a ferry. They finish by...
Cornell University
Thinking with the Eyes
Objects are larger (or smaller) than they appear! Scholars use a laboratory investigation to explore the difference between resolution and magnification. The activity allows them to calculate the size of the field of view of their light...
Howard Hughes Medical Institute
The Great Elephant Census Modeling Activity
They say elephants never forget—and your class won't forget an insightful modeling activity either! Junior zoologists take part in a mock elephant census using the sample count and total count methods. The included materials provide...
Concord Consortium
Summertopia
What if the unit of money changes tomorrow? Would you be prepared? Learners calculate currency conversions using fictional units of money. The fictional unit's base is 60 rather than 100, which can connect to time or even degrees.
Kenan Fellows
Algebra I Review, Solving for Unknown Variable
Many high school science courses rely on mastery of algebra skills. In an integrated chemistry and Algebra II lesson scholars review solving equations for a specified variable with a worksheet. They use common chemistry equations to...
Howard Hughes Medical Institute
Weighing the Evidence for a Mass Extinction: Part 1 – In the Ocean
Extinction events have happen throughout geologic history, but only five mass extinctions occurred over the last 4.5 billion years. Scholars view fossils from a layer of sediment during an extinction event and observe patterns to draw...
Mathematics Vision Project
Module 6: Modeling Periodic Behavior
Around and around we go ... again, and again, and again, and again! That's the nature of a periodic function. Young scholars learn how to model a periodic pattern with trigonometric functions. The nine-lesson unit explores the connection...
Howard Hughes Medical Institute
Mapping Genes to Traits in Dogs Using SNPs
Genetic analysis has gone to the dogs! Learners use real DNA information collected from dog saliva to study the relationship between genotypes and phenotypes. They analyze alleles to determine correlations to coat color, length, and...
Purdue University
Plastic Water Bottle Design – What’s the Best Shape?
Join the fight to reduce plastic waste. A hands-on STEM activity first teaches scholars about the scourge of plastic waste. They then measure the dimensions of water bottles to calculate surface areas and volumes before using the surface...
Howard Hughes Medical Institute
Classroom Activities: What Is My Carbon Footprint?
Everyone leaves an impression on the world—some more than others. An interactive lesson has learners analyze their lifestyles and the impact they have on the environment. The analysis includes travel, food, and energy categories and ends...
Radford University
SAT and ACT – How Equitable Are They?
Test the test takers' knowledge of statistics about data from the SAT and ACT tests. Future collegians explore the idea of gender and racial bias in high-stakes college admissions exams. They analyze historical data on average scores by...
Radford University
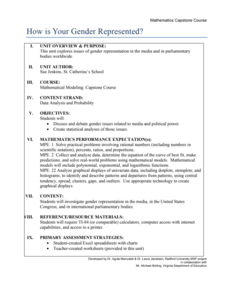
How Is Your Gender Represented?
Does the media shape people's views on gender? Scholars use data on gender portrayal in magazines to explore the idea. They use a spreadsheet program to create bar graphs and perform a chi-square test. They also use provided data to...
Radford University
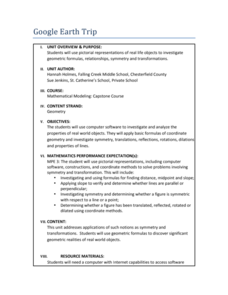
Google Earth Trip
Travel the world instantly—and learn about math along the way. Using pictures of famous places taken from Google Earth, scholars look for parallel and perpendicular lines based on slope and angle measurements. They also calculate...
Radford University
Building Sandcastles
Finalize the plans before playing in the sand. Learners design sandcastles using geometric and composite figures. They create blueprints, including the scale, and three-dimensional models of their castles. Finally, scholars calculate the...
Radford University
Snappy Stair Sprints
Let's go for a run. Small groups determine a way to collect data to determine the time it would take to run a set of stairs. After creating a plan, teams collect data and graph their results, calculating the equation of best fit and...
Bowland
Lottery
Take a chance on raising money. Learners calculate probabilities to determine whether a lottery is a good way to raise money. Pupils determine the number of combinations of choosing two numbers between one and six. Using the sample...
Bonneville
Electrical Energy and Solar Module Efficiency
It's much more efficient if everyone knows the relevant terms. Pupils research vocabulary terms related to electric currents to start a unit on solar energy. They then use a multimeter to measure the voltage and current for a solar...
Nemours KidsHealth
Smoking: Grades 6-8
Light up middle schoolers' understanding of the monetary and health costs of smoking with two activities. First, class members calculate how much a smoker would spend in a year if they smoke a pack a week or a day. They then explore...
American Statistical Association
How Long Are the Words in the Gettysburg Address?
It's 268 words, but one only needs to consider 10 of them at a time. A data collection and analysis activity has learners investigate the lengths of words in the Gettysburg Address. They first self-select a sample of 10 words and...
Curated OER
A.P. Exam Calculator Review
Students review ways to use the calculator to graph a function, solve an equation, calculate a numerical derivative, and calculate a definite integral. They practice using their calculator to solve a set of sample exercises. Students...
Curated OER
Statistical Analysis For Graphing Calculators
Students analyze date from the Chesapeake Bay. Using a graphing calculator, they enter the data, plot three temperatures, and create a Box and Whisker plot.
Curated OER
Units in Thermochemical Calculations
Learners study how to complete thermochemical equations. In this equation lesson students learn how to manipulate equations to calculate energy changes and reactions.
Curated OER
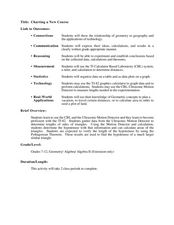
Charting a New Course
Students calculate the distance they will travel. In this geometry lesson, students use the TI and CBL system to make calculation of a certain path. They explore geography by calculating distances between different areas as it relates to...
