Curated OER
Calculate Percentages
Sixth and seventh graders study the concept of finding the percent of a number. They calculate the percent of any given number. Pupils describe ways to use calculating percents in their daily life, and change percents into decimals,...
Curated OER
Restaurant Tipping Lesson
What do you do after a good meal, tip the server of course. The class calculates the appropriate tip to leave at a restaurant given certain bills. They identify the bill before and after tax and find the correct tip. A great way to put...
Curated OER
Calculators
Young scholars investigate the four basic operations of mathematics that are addition, subtraction, multiplication, and division. The use of a technology game is part of the lesson. They demonstrate the proper use of a calculator as part...
Curated OER
Graphing Calculator Activity: Multiplying and Dividing Mixed Numbers
In this graphing calculator worksheet, students explore necessary steps to multiply and divide mixed numbers using a graphing calculator. In groups, students measure objects in their classroom and write equations using their collected...
Curated OER
Calculating Perimeter and Area of Polygons
Students discuss strategies for estimating information about various shapes. Once they draw and label four shapes with perimeters of 30 units, they calculate the areas of the figures. To complete the lesson, students offer written...
Curated OER
Orienteering - Lesson 5 - Compasses
Out in the middle of nowhere and not sure which way to turn? Learn how to use a compass so you don't ever have to be lost in the wilderness. Learn how to pick a landmark and get a bearing. This instructional activity is one part of a 10...
Curated OER
Small Angle Calculations
Students work with circles, angles and estimating angles in the night sky. In this circles and angles lesson, students practice measuring a degree using the circumference of a circle and apply the degree to determine a way to use their...
Eisenhower Regioanl Consortium for Mathematics and Science Education
Lesson 10: Integer Addition and Subtraction (for the TI-73 only)
Using a number line on the floor made from masking tape and manipulatives, learners observe a demonstration of the addition and subtraction processes. After completing several worksheets, they solve three-term problems using calculators...
Teach Engineering
Levers that Lift
Introduce your class to to the remaining three simple machines-- the lever, pulley, and the wheel-and-axle with a plan that includes the three different types of levers in the discussion of levers. The lesson continues with the...
Curated OER
Orienteering - Lesson 1 - Maps & Map Scales
Lesson 1 of 10 lessons in this orienteering unit is about maps and map scales. After all, orienteering is all about maps, compasses, and finding ones' way around. It is imperative to be able to read maps and understand the relevance of...
Curated OER
Chinese New Year: A Simple Lesson in Debt, Percent, and Loan Interest
Students study Chinese New Year traditions while investigating the concepts of percent and loan interest. They apply the concepts to calculate the total debt on monies borrowed.
EngageNY
Getting the Job Done—Speed, Work, and Measurement Units II
How fast is your class? Learners determine the amount of time it takes individuals to walk a given distance and calculate their speeds. Pupils solve distance, rate, and time problems using the formula and pay attention to the...
Virginia Department of Education
Hoppin' on the Elapsed Time Line
Time flies when you're teaching math! Okay, maybe not for everyone, but this lesson will have your young mathematicians calculating elapsed time before you know it.
101 Questions
Amazon Percent Discount
Everyone loves a good sale! A straightforward lesson provides practice with calculating a percent off of a product. Using ads from Amazon, individuals calculate the percent off the ad does not show. Pupils see the answer after revealing...
Science Geek
Thermochemical Calculations
Viewers learn where the heat goes when phase changes take place with a presentation that explains the latent heat of phase changes, or, more specifically, the molar heat of fusion, solidification, vaporization, and condensation. The show...
EngageNY
Using Sample Data to Compare the Means of Two or More Populations II
The 23rd segment in a series of 25 presents random samples from two populations to determine whether there is a difference. Groups determine whether they believe there is a difference between the two populations and later use an...
Flipped Math
Correlation
Determine how close the line is to the scatter plot. Clear video instruction shows how to plot a scatter plot and find the best fit line using the linear regression function on a calculator. Pupils use the information from the calculator...
Flipped Math
Simulations
Simulate an exciting graphing calculator-based lesson. Individuals watch and participate creating simulations using the random number generator in a graphing calculator to answer probability problems. Learners then build simulations to...
Baylor College
Your Energy Needs (BMR)
How many Calories one needs on a daily basis is dependent on a number of factors including gender, height, and activity level. In the third of seven lessons about energy and food, young nutritionists calculate the number of Calories...
Illustrative Mathematics
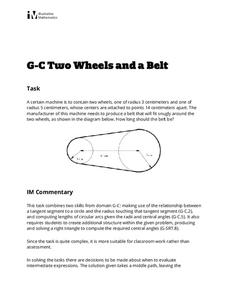
Two Wheels and a Belt
Geometry gets an engineering treatment in an exercise involving a belt wrapped around two wheels of different dimensions. Along with the wheels, this belt problem connects concepts of right triangles, tangent lines, arc length, and...
US Department of Commerce
Applying Correlation Coefficients - Educational Attainment and Unemployment
Correlate education with unemployment rates. Individuals compare state and regional unemployment rates with education levels by calculating the correlation coefficient and analyzing scatter plots. Pupils begin by looking at regional data...
National Council of Teachers of Mathematics
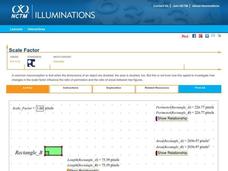
Scale Factor
Does doubling mean everything doubles? Learners adjust the scale factor between two rectangles. Using the calculated measurements, pupils investigate the ratios between the lengths, perimeters, and areas of the rectangles.
NASA
MASS, MASS – Who Has the MASS? Analyzing Tiny Samples
What is it worth to you? A hands-on activity asks groups to collect weights of different combinations of coins and calculate weighted averages. They use the analysis to understand the concept of an isotope to finish the third activity in...
101 Questions
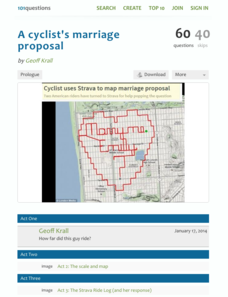
A Cyclist's Marriage Proposal
One cyclist goes to great lengths to make his proposal! Your classes must figure out just what length that is. Using a map with a bike route that spells out Marry Me, learners calculate the total distance of the ride. They base their...
