Curated OER
Technobiz
Students examine candy preferences to create a plan in order to improve candy sales. In this technobiz lesson, students build spreadsheet and organizational skills by graphing and calculating data. Students are introduced to terminology...
Curated OER
Charts and Graphs
Fifth graders interpret data into graphs and percentages. In this organizing data lesson, 5th graders discuss bar, circle and line graphs. Students complete bar graph and apply probability using the results.
NOAA
Plate Tectonics II
Mid-ocean ridges, rift valleys, island arcs, mountain ranges, earthquakes, volcanoes ... there are so many features associated with plate tectonics. The 14th installment of a 23-part NOAA Enrichment in Marine sciences and Oceanography...
Curated OER
Mechanical Properties of Chocolate: How Hard is your Chocolate?
Pupils calculate, measure and identify the hardness of various chocolate bars. They determine the hardness of the chocolate bar using quantitative data. Students make observations of the hardness of chocolate while dropping the indenter...
Curated OER
Bite Sized Core Sampling
Students define the origin of rock samples and how surface core samples can tell us about the history and make-up of Mars. Candies are used as a Martian surface sample. Students study the samples and make a hypothesis about the cause of...
Curated OER
Chocolate Bar Bugs & Marshmallow Spiders
Students create an insect model with food materials. After a brief discussion of insects, student use food materials provided by the instructor to create their own insect model. Models are shared with the class before they are eaten by...
Curated OER
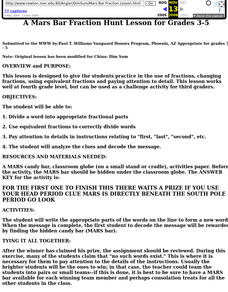
China: Dim Sum: A Mars Bar Fraction Hunt Lesson
Students practice in the use of fractions, changing fractions, using equivalent fractions and paying attention to detail.
Curated OER
Skittle Graphing (Lesson Plan)
Students discuss the uses of graphs. They use color candies to count and sort before designing graphs. They label the graph papers with appropriate titles and candy colors. They complete the graph bars, and discuss the results with a...
Curated OER
The Statistics of M&Ms
Students explore the topic of statistics with M and Ms. For this math lesson plan, students use candy pieces to sort and gather information needed to create a bar graph. This lesson can be adapted to accommodate students in grades 1-12.
Curated OER
Organizing And Reading Data
Students complete three parts of an "Organizning and Reading Data" worksheet. First, they go over the rubric to determine the work will be scored. They organize data by taking tallies, make a pictograph and a bar graph using the data....
Curated OER
Skittles, Taste the Rainbow
Fifth graders learn and then demonstrate their knowledge of a bar and a circle graph using the classroom data. Students are given a pack of skittles candy. Students create a bar and circle graph indicating the results of the contents of...
Curated OER
Junk Food Math
Students use Skittles candies as they explore estimation and percentages. In this math lesson plan, students sort, count, and chart Skittles candies to learn about estimation and study percentages.
Curated OER
Chocolate Place - Factories around the world
Students create a PowerPoint presentation on how chocolate is made. For this chocolate lesson, students locate chocolate factories around the world, and study the process of converting the cacao seed into a chocolate bar. Students share...
Curated OER
Fraction Fun With Food
Students use candy and pizza to identify concepts associated with fractions. They work together in groups to create fractions. They complete a worksheet individually to complete the activity.
Curated OER
M&M Caper
Students participate in a game with M&M's to be introduced to percents and ratios. Individually, they estimate and record the number of candies they believe the bag holds and the amount of each colored candy. They open the bag and...
Curated OER
Math: How Many Red M&Ms?
Sixth graders calculate the mean, median, and mode of candy M&Ms and find the percentage of each color. Once they complete the assignment, they compare their results with those of the candy company's percentages. As an extension,...
Curated OER
Halloween Graphitti
Students complete multi-curricular activities in a Halloween themed lesson. In this Halloween lesson, students examine newspaper ads to find prices of pumpkins and use them to complete a stem and leaf plot. Students find the diameter,...
Virginia Department of Education
Three Types of Rocks
Rock out with the second installment of a five-part series on earth materials and processes. Your budding geologists make observations of given rock samples and posit classification systems for rocks. They then learn about the...
Curated OER
Button Bonanza
Collections of data represented in stem and leaf plots are organized by young statisticians as they embark some math engaging activities.
Curated OER
Using Spreadsheets and Graphs
Third graders explore mathematics by utilizing computers. In this graphing lesson, 3rd graders gather class data based on a particular topic such as the "favorite candy" of the class. Students utilize this information and computers to...
Curated OER
Put Your Heart Into It
First graders sort Valentine candies according to kind. Data is inserted into a spreadsheet and displayed in various graphic formats.
Curated OER
Fractions - Equal or Not
A fabulous lesson on fractions awaits your young mathematicians. In it, learners are invited to explore the world of fractions by accessing websites that have educational activities and worksheets embedded in them. Some excellent,...
Curated OER
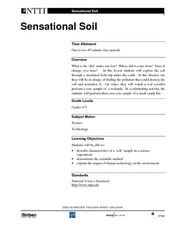
Sensational Soil
Fourth and fifth graders explore soil by taking a simulated field trip under the earth. They go to an Internet site that runs a simulation which charges them with finding a source of pollution that could destroy all of Earth's soil, and...
Curated OER
The Peanut Wizard
Students read and discuss information regarding George Washington Carver and how the peanut became cultivated in the southern colonies of the United States. In this George Washington Carver lesson, students develop vocabulary that...
Other popular searches
- Candy Bar Poem
- Candy Bar Math
- Candy Bar Fractions
- Candy Bar Nutrition Label
- Rock Candy Bar Graph
- Candy Bar Economics
- Mars Candy Bar
- Candy Bar Poll
- Candy Bar Life
- Candy Bar Lesson
- Candy Bar Graphs
- Candy Bar Graphing


