Curated OER
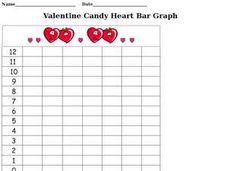
Valentine Candy Heart Bar Graph
In this Valentine candy heart bar graph worksheet, students complete a bar graph illustrating how many different colored candy hearts they received for Valentine's Day.
Curated OER
Circle Up Your M&Ms
Fifth graders estimate how many M&Ms are in a pre-counted bag. They determine how many colored M&Ms are in a bag, then decide which of the two, bar graph or circle graph (in this case, circle graph) would be best to show te results.
Curated OER
Which Graph is best?
Students use commercial software to organize and visually display data to draw conclusions; students use graphing software to create several types of graphs illustrating the number of each color of M&M's in one bag.
Curated OER
Using Spreadsheets and Graphs
Third graders explore mathematics by utilizing computers. In this graphing lesson, 3rd graders gather class data based on a particular topic such as the "favorite candy" of the class. Students utilize this information and computers to...
Curated OER
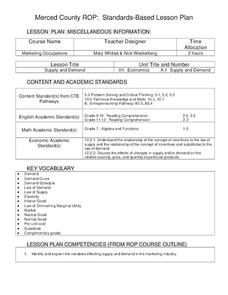
Marketing Occupations
Young scholars identify and explain the variables effecting supply and demand in the marketing industry. Then they define the terms supply and demand and graph supply and demand curves on a standard grid. Students also formulate what...
Curated OER
Spicy Hot Colors
First graders discover the importance of primary colors by reading a book in class. In this art lesson, 1st graders read the book Spicy Hot Colors, and discuss the three primary colors and the numerous combinations they can make....
Curated OER
Cleaning Up
Pupils demonstrate how to be a philanthropist. In this philanthropy lesson, students read the story The Wartville Wizard and discuss ways to become a philanthropist. Pupils participate in a good deed by volunteering to clean up trash.


