EngageNY
Conditional Relative Frequencies and Association
It is all relative, or is it all conditional? Using an exploration method, the class determines whether there is an association between gender and superpower wish through the use of calculating conditional relative frequencies. The last...
EngageNY
Scatter Plots
Scholars learn to create scatter plots and investigate any relationships that exists between the variables with a activity that also show them that statistical relationships do not necessarily indicate a cause-and-effect relationship.
Curated OER
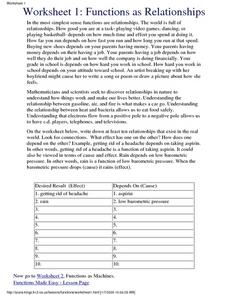
Functions As Relationships
In this algebra worksheet, students read the information about the relationships of functions and then they fill in the graphic organizer with the information at the bottom of the page.
Curated OER
The Lake Effect
Fourth graders conduct an experiment demonstrating the effects of water and air temperature on precipitation. They create graphs demonstrating their findings using Claris Works for Kids.
Curated OER
Stick-Slip Movement
Ninth graders operate a model to observe the type of motion that occurs at a fault during an earthquake. They explore the effects of several variables. Students measure movement, calculate averages and plot and graph information.
Curated OER
Changes in Latitudes, Changes in Attitudes
Sixth graders discuss how people, society, and technology change over time through a unit of integrated lessons. In these changes in society lessons, 6th graders discuss the answers to many questions about how changes effect the...
Curated OER
Functions Made Easy
Students explore concept of functions as relationships, as machines, as equations, and as graphs.
Curated OER
Moving Straight Ahead
Students analyze the relationship between speed, time and distance. In this math lesson, students plan a school trip. Students determine the efficiency and cost effectiveness of a trip.
Curated OER
Investing
Learners collect data on investments and draw conclusions. In this algebra lesson, students analyze exponential graphs as they relate to money. They discuss the cause of an account balance being high or low.
Texas Woman’s University
Patterns, Patterns Everywhere!
Not only is pattern recognition an essential skill for young children to develop, it's also a lot of fun to teach! Over the course of this lesson, class members participate in shared readings, perform small group activities, and complete...
Curated OER
Data Analysis and Froot Loops
Use this probability and graphing lesson plan to have your learners work with a partner to make a necklace out of Froot Loops. They record the cereal colors randomly chosen and strung, graph their data, then use a ratio formula to...
Curated OER
Follow the Road to Riches
Learners study the story of gold and silver mining in the San Juan region. Through the use of interactive video and the Internet, they will examine the various events occurring at this time. They create a timeline highlighting the major...
Curated OER
Jelly Bean's Galore
Young scholars investigate the origins of the Jelly Bean. They complete a Scavenger Hunt using the jellybean website. Pupils create a bar graph using information collected about jelly beans. Students discuss the time of year that Jelly...
Curated OER
One, Two, Three...and They're Off
Students make origami frogs to race. After the race they measure the distance raced, collect the data, enter it into a chart. They then find the mean, median, and mode of the data. Next, students enter this data into Excel at which time...
Curated OER
Plant Systems
Second graders learn about plant systems and how plants grow and function. In this plant lesson plan, 2nd graders collect data based on roots, leaves, terrariums, plant uses, and locations of certain kinds of plants. They fill out...
Curated OER
What are Fractals?
Middle and high schoolers identify and analyze fractals and research information using the Internet to locate information about them. They look at fractals in relation to nature and other real world situations. Pupils create several...
Curated OER
Hurricane Tracking
Students access the Internet to find information on current hurricanes. They get locations, speeds, and air pressures and then plot the location of the hurricane on a hurricane-tracking map. They also access the FEMA website to solve...
Curated OER
Jelly Belly: What a Wonderful "Bean"!
Students explore how jelly beans are produced. They discuss the origins of the jelly bean and view a video about how jelly beans are prepared, tested, shaped, finished, and shipped and estimate the amount of jelly beans in a jar and sort...
Curated OER
An Apple A Day
Students create a graph that showcases their pick for favorite kind of apple. Students are given samples of a variety of apples to determine their favorite in a taste test. They a create a tally chart of favorite kinds apples and use a...
Curated OER
"how To Think Like an Archaeologist" Suggested Pre-visit Activity for Historic Jamestowne
Students study grocery receipts to simulate the archaeological activity of classifying items. They discuss the receipts as if they were find lists.
Curated OER
To Be Linear or Not to be Linear, That is the Question
Students use their knowledge and understanding of equations of lines to explore independent and dependent variables. They determine how to isolate a variable and how to predict data points not represented in data.
Curated OER
Stocking Up
Eighth graders are trained to be brokers and to buy and sell stocks. Each group is allotted $1000. Team members work together within their groups to build a stock market portfolio and track the stocks they own.
Curated OER
Building Bridges
Students identify the different types of bridges. Using the internet, they research information on how they are built by completing a scavenger hunt. Locating a specific area, they determine which type of bridge would be appropriate and...
Curated OER
What is a Family?
Students explore how Canadian families have evolved over time. In this census results lesson plan, students examine the factors that contribute to changing family and household structures. Students also create written and illustrated...


