Curated OER
Ball Toss Activity
Pupils collect data from tossing a ball into the air. Using a data collection device, they graph the data, set a window, and analyze the height of the toss, how long the ball was in the air, etc. They then find an equation that models...
Curated OER
World Cities of 5 Million or More
Students consult online resources to identify and map the world's largest cities and metropolitan areas. They analyze birth rates, settlement patterns and other demographic data and make predictions for the future. They write essays...
Curated OER
Discovering Different Types of Functions
Graph polynomials and identify the end behavior of each polynomial function. The class differentiates between linear, quadratic, and other polynomial equations.
Texas Instruments
Measure Up!
Statisticians take things to new heights using a set of height measurements. Students use TI-82 or TI-83 calculators to determine extreme values and the median for the data. They also construct a box-and-whisker plot to summarize the...
Curated OER
A Tall Story
Students investigate the growth rate of a man named Bob Wadlow. In this growth rate of a man lesson, students determine if the growth rate of this particular man was normal or abnormal. Students bring in data of their height...
Curated OER
"Ball Bounce" Quadratic Functions
Young scholars manipulate a ball and explore quadratic functions. In this algebra instructional activity, learners analyze the graph of a quadratic function. They identify quadratic properties.
Curated OER
Graphical Analysis of Straight-Line Motion
Students investigate the concept of straight line motion. They determine the pattern and graph it looking for the motion maintained at a constant speed. Students also write a description of the significance of the line. The skill of...
Curated OER
Round and Round and Round We Go!
Pupils investigate motion using a CBL. For this algebra lesson, students collect and graph data on a coordinate plane. They define and identify amplitude and period of conic graphs.
Curated OER
The Demographic Transition-A Contemporary Look at a Classic Model
Students evaluate and apply models to explain changes in global demographic patterns, and use their assessments to predict future needs.
Curated OER
Big Wheels Keep on Turning
Eleventh graders work in groups and investigate how force determines the speed and distance then they view the video, "Math Vantage #7: What's Your Angle?." They are given a real life problem to solve using speed, ramps, angle, incline...
Curated OER
Mathematical Models with Applications: What's Your Rate of Change?
Learners use regression methods available through technology to select the most appropriate model to describe collected data and use the model to interpret information. They use numeric techniques to write the equation of a line that...
Curated OER
The Wave of the Future
Twelfth graders discuss sine curves and enter equations into their graphing calculator then compare different graphs created on their calculators. They identify the period, amplitude and phase shift given the graph or the equation of a...
Curated OER
Modeling With Circular Functions
Students explore circular functions. They identify the amplitude, period, phase shift and vertical shift of circular functions. Students analyze phenomena described by sine waves and they find mathematical models for transforming images...
Texas Instruments
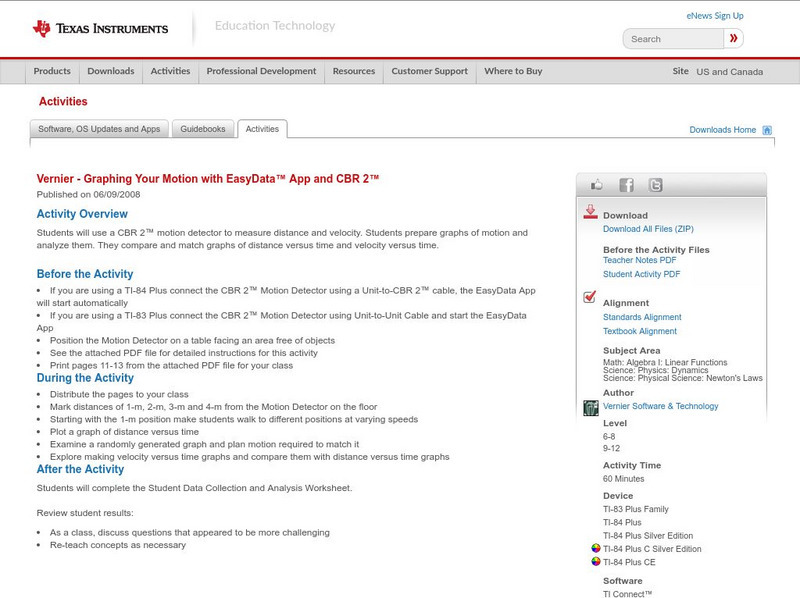
Texas Instruments: Graphing Your Motion With Easy Data App and Cbr 2
Students can use a CBR 2 motion detector to measure distance and velocity. Students prepare graphs of motion and analyze them. They compare and match graphs of distance versus time and velocity versus time.
Texas Instruments
Texas Instruments: Vernier a Speedy Slide With Easy Data App and Cbr 2
Students can use a CBR 2 motion detector to determine their speed or velocity going down a playground slide. They will also experiment with different ways to increase their speed going down the slide.
Texas Instruments
Texas Instruments: Get on the Stick
In this activity, students use a CBR 2 to measure the reaction time of catching a stick. They also learn how to interpret a box plot, and make a five number summary of a single variable data set.
Texas Instruments
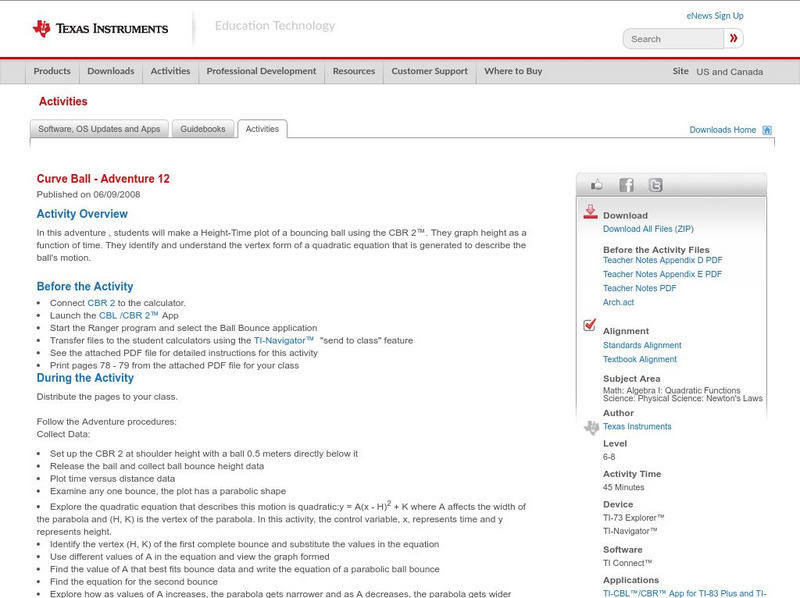
Texas Instruments: Curve Ball Adventure 12
In this adventure , students will make a Height-Time plot of a bouncing ball using the CBR 2. They graph height as a function of time. They identify and understand the vertex form of a quadratic equation that is generated to describe the...
Texas Instruments
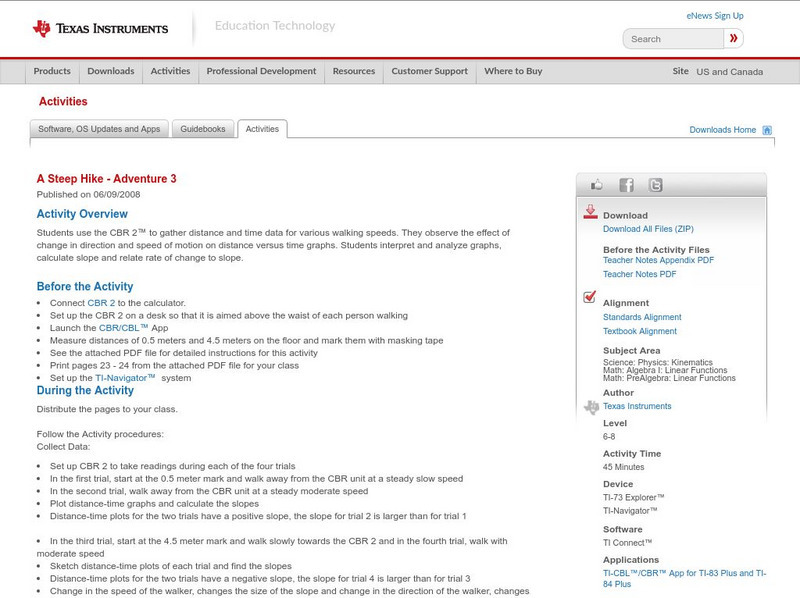
Texas Instruments: A Steep Hike Adventure 3
Students use the CBR 2 to gather distance and time data for various walking speeds. They observe the effect of change in direction and speed of motion on distance versus time graphs. Students interpret and analyze graphs, calculate slope...
Texas Instruments
Texas Instruments: Falling Down Adventure 5
Students use the CBR 2 to study how a change in mass affects the average speed of a falling object. They graph distance as a function of time, and interpret and analyze graphs representing motion.
Texas Instruments
Texas Instruments: Buried Objects Adventure 1
Students use the CBR 2 to gather data and identify "buried" objects. They interpret and analyze graphs of height as a function of time, and use the change in the y-coordinates of an ordered pair to determine the height of an object.
Texas Instruments
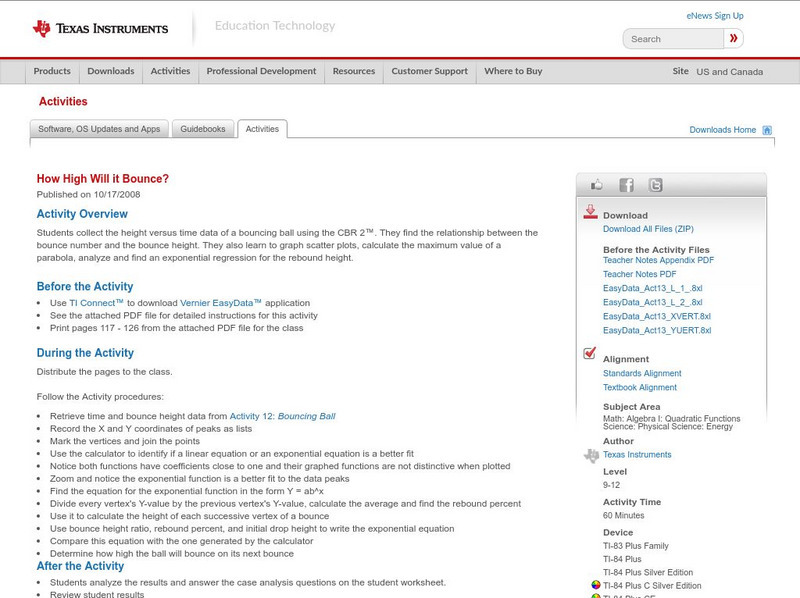
Texas Instruments: How High Will It Bounce?
In this activity, students collect the height versus time data of a bouncing ball using the CBR 2. They find the relationship between the bounce number and the bounce height. They learn to graph scatter plots, calculate the maximum value...
Texas Instruments
Texas Instruments: Bouncing Ball
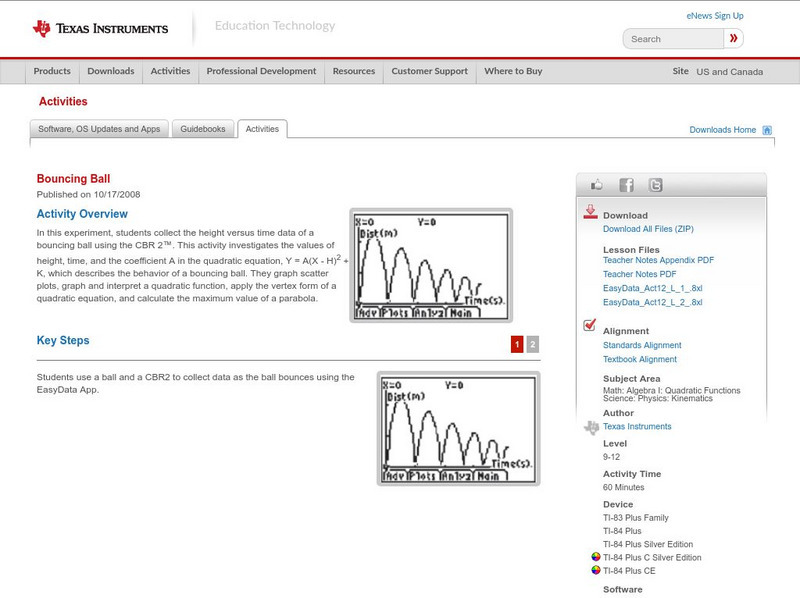
In this experiment, students collect the height versus time data of a bouncing ball using the CBR 2. This activity investigates the values of height, time, and the coefficient A in the quadratic equation, which describes the behavior of...
Texas Instruments
Texas Instruments: Walk My Walk
A two-part activity that uses a CBR to develop the notion of slope and y-intercept through various walking activities. Part A develops a general notion of how changes in walking are reflected in various graphical representations. Part B...
