Curated OER
Round and Round and Round We Go!
Pupils investigate motion using a CBL. For this algebra lesson, students collect and graph data on a coordinate plane. They define and identify amplitude and period of conic graphs.
Curated OER
Quadratic Applications
In this quadratic applications worksheet, students complete graphs, charts, comparison charts, and more having to do with quadratic equations. Students complete 5 different activities.
Curated OER
Discovering Different Types of Functions
Graph polynomials and identify the end behavior of each polynomial function. The class differentiates between linear, quadratic, and other polynomial equations.
Curated OER
A Steep Hike
Learners explore slope. In this middle school mathematics lesson, students analyze and interpret graphs as they investigate slope as a rate of change. Learners use a motion detector to collect data as they walk at different...
Curated OER
Walk the Line
Learners create constant speed versus motion graphs. They will perform linear regressions on their data to describe the graphs mathematically.
Curated OER
Falling Objects
High schoolers examine the velocities of two different falling objects. They produce distance vs. time and velocity vs. time graphs using a Motion Detector and a CBL 2 to collect experimental data. Learners analyze and interpret the...
Curated OER
A Tall Story
Students investigate the growth rate of a man named Bob Wadlow. In this growth rate of a man lesson, students determine if the growth rate of this particular man was normal or abnormal. Students bring in data of their height...
Curated OER
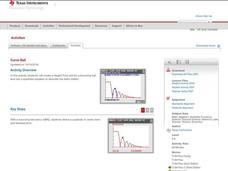
Curve Ball
Learners explore the concept of parabolas by collecting quadratic data on a bouncing ball as it is falling using a motion detector. They plot the data and determine the equation of the quadratic in vertex form, then determine the values...
Curated OER
Lesson Plan 1: Up, Down, Right, Left - Function Families
Students work in small groups to draw the trajectory of several scenarios. They label parts of the resulting parabola (vertex, axis of symmetry). Students complete four stations to explore quadratic functions.
Curated OER
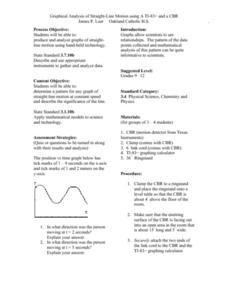
Graphical Analysis of Straight-Line Motion
Students investigate the concept of straight line motion. They determine the pattern and graph it looking for the motion maintained at a constant speed. Students also write a description of the significance of the line. The skill of...
Curated OER
Ball Toss Activity
Pupils collect data from tossing a ball into the air. Using a data collection device, they graph the data, set a window, and analyze the height of the toss, how long the ball was in the air, etc. They then find an equation that models...
Curated OER
Match Me Plus
Have your class investigate Piecewise functions by matching a position versus time graph to the function that describe the walk.
Curated OER
Bouncing Ball Experiment
Students collect data for a bouncing ball and select one bounce to analyze. They explore the relationship between velocity, position and acceleration. They seek out connections between the graphs and the physical motion of the ball.
Curated OER
Graph Your Motion
Students graph their linear equations. In this algebra lesson, students examine their lines and relate it to the slope or rate of change. They relate the steepness of the line to the slope being positive, negative or zero.
Curated OER
Mathematical Models with Applications: What's Your Rate of Change?
Learners use regression methods available through technology to select the most appropriate model to describe collected data and use the model to interpret information. They use numeric techniques to write the equation of a line that...
Curated OER
"Ball Bounce" Quadratic Functions
Young scholars manipulate a ball and explore quadratic functions. In this algebra instructional activity, learners analyze the graph of a quadratic function. They identify quadratic properties.
Curated OER
Modeling With Circular Functions
Students explore circular functions. They identify the amplitude, period, phase shift and vertical shift of circular functions. Students analyze phenomena described by sine waves and they find mathematical models for transforming images...
Texas Instruments
Texas Instruments: Creating Piece Wise Functions Using Cbr System
In this lesson, students can use the CBR ranger to model walking distance over time. They will walk away from the sensor, back towards the sensor and finally away from the sensor over an interval of 10 seconds. The result should be 3...
Texas Instruments
Texas Instruments: Numb3 Rs: Seeing in the Dark
Based off of the hit television show NUMB3RS, this lesson has students try to emulate a time vs. distance graph on their graphing calculator using the CBR2. Next, the CBR2 is "swept" across an area in which three students are standing to...
Texas Instruments
Texas Instruments: Collecting Ball Bounce Data
Many aspects relating to the motion of a bouncing ball can be modelled mathematically. The first stage in modelling the motion is to collect some data. The Calculator Base Laboratory or CBR is a motion detector that can be connected to a...
Texas Instruments
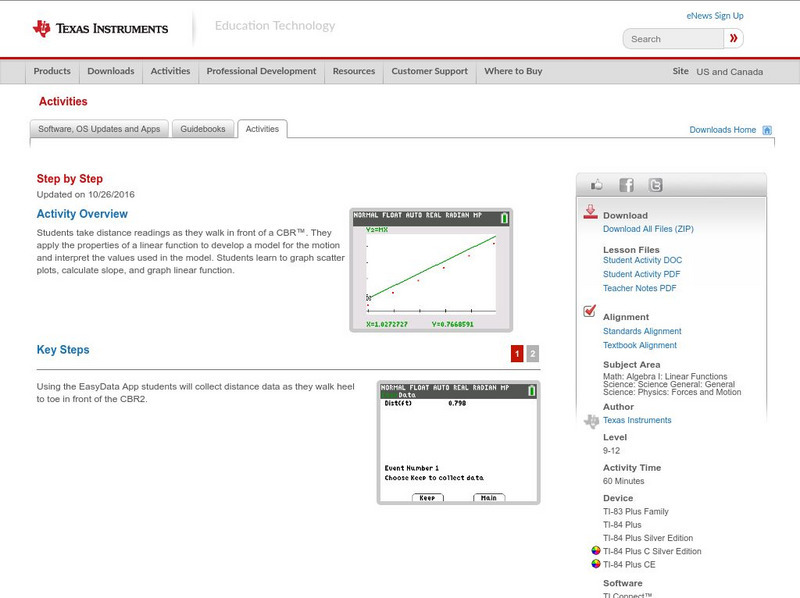
Texas Instruments: Step by Step
In this activity, students take distance readings as they walk in front of a CBR. They apply the properties of a linear function to develop a model for the motion and interpret the values used in the model. Students learn to graph...
Texas Instruments
Texas Instruments: On Your Mark, Get Set, React
This session will demonstrate a novel approach to reaction time experiments done in junior science and mathematics courses. Participants will use a Calculator-Based Ranger (CBR) and a TI-83+ to record their reaction times.
Texas Instruments
Texas Instruments: Match the Graph
In this activity, students walk in front of a calculator-based ranger CBR and try to match a distance-time graph. They examine the rate of change, and analyze and interpret the graph of a function.
Texas Instruments
Texas Instruments: A Steep Hike Adventure 3
Students use the CBR 2 to gather distance and time data for various walking speeds. They observe the effect of change in direction and speed of motion on distance versus time graphs. Students interpret and analyze graphs, calculate slope...


