Curated OER
Untying the Knot
What are the current trends in divorce? What contributes to this? Examine celebrity relationship trends and how they relate to the general public with this discussion lesson. Middle schoolers analyze the results of a Census Bureau study...
Curated OER
A Slice of the Census
High schoolers learn why the census makes a difference. In this U.S. Census lesson plan, students examine the importance of each census question and explain the measures taken to protect the confidentiality of personal information on the...
Curated OER
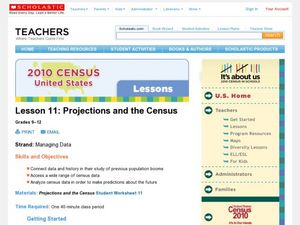
Projections and the Census
Students learn why the census makes a difference. In this U.S. Census lesson plan, students connect data and history in their study of previous population booms and analyze census data in order to make predictions about the future.
Curated OER
Getting Active in the Census
Learners learn why the census makes a difference. In this U.S. Census lesson plan, students identity ways to participate in the 2010 Census while they understand the need the need for citizen action to reduce the risk of undercounts.
Curated OER
The Role of Individuals and Groups in the Census
Students learn why the census makes a difference. In this U.S. Census lesson plan, students describe and explain the roles that individuals, government agencies, and partner groups play in the census.
Curated OER
The Demographics of Immigration: Using United States Census Data
Learners work together to analyze United States Census data on immigration. They compare and contrast the data and determine how immigration numbers have changed over time. They calculate percentages and make their own conclusions...
Curated OER
Redistricting: Drawing the Lines
Difficult redistricting concepts are covered in a context that will make it understandable to your government scholars. They begin with a KWL on the term redistricting and then watch a video to answer some questions. They analyze...
Curated OER
1930 Census and the Consitution
Students read the Constitution and discuss the importance of enumeration. In this Census lesson, students complete a Census schedule and discuss the job skills of applicants. Students research Census data to compare and contrast the...
Curated OER
Lesson 1: Map Data and the Census
Students learn about the history of the census. In this U. S. Census lesson plan, students develop an understanding about how the United States Constitution grants and distributes power and discover how the spatial organization of...
Curated OER
Create Your Own Form
Students gather and organize data using a mock census form, and determine mean, mode, range, and median for sets of data.
Curated OER
Celebrating Our Nation's Diversity
Second graders conduct a class census to measure diversity.
Curated OER
By Any Other Name
Students examine the differences between the definitions of race and ethnicity defined by the United States government. After reading an article, they discuss the possiblity of the elimination of some races from the 2010 census. They...
Curated OER
Population Pyramids
Students utilize population pyramids to answer questions, make comparisons, draw conclusions and support predictions about the populations of China, India and the Unites States. They arrange numbers and symbolic information from various...
Curated OER
Population Pyramids
Young scholars work with and make population pyramids. In this population pyramid lesson, students use census data to make population pyramids for China, India, and the United States. They use the information to determine why jobs are...
Curated OER
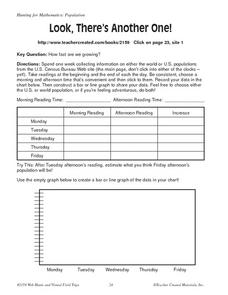
Look, There's Another One!
In this math worksheet, learners spend a week collecting information on either the word or U.S. populations from the U.S. Census Bureau Web site. Students record their data in a chart and bar graph. Learners also use the website to...
Curated OER
Committing to Respect: Lessons for Students to Address Bias
Here's a guide designed to build safe, respectful learning environments, and to build understanding of the value of diversity through lessons packed with activities for specific grade levels.
Curated OER
Celebrate Hispanic Heritage Month!
Students use information from the U.S. Bureau of the Census to create a bar graph, a picture graph, or a circle graph showing the country of origin of U.S. Hispanics.
Statistics Education Web
Types of Average Sampling: "Household Words" to Dwell On
Show your classes how different means can represent the same data. Individuals collect household size data and calculate the mean. Pupils learn how handling of the data influences the value of the mean.
Curated OER
World Statistic Day
Eleventh graders collect data about the state they live in. In this statistics lesson, 11th graders collect and analyze data as they compare themselves to students in other states. They analyze data about a person's education level, and...
Global Oneness Project
Citizen Photojournalism
Matt Black's photo essay, "The Geography of Poverty" provides a shocking reminder of the poverty that exists in the United States. The resource not only focuses attention on poverty but also conditions that have given rise to situation...
Curated OER
Factors In Population Growth
High schoolers examine both historical and recent estimates of world population. They identify regions of the world that have had significant population growth in the last decade and speculate on reasons for this.
Curated OER
Exponential Models
Students fit a constant growth rate exponential model to U.S. population data and use the model to predict future population. They write an equation to determine U.S. population based on constant growth rate model.
Curated OER
Modeling Population Growth
Students create linear, exponential, and quadratic models of U.S. population data to determine which function best represents U.S. population growth. They predict future populations based on each model.
Curated OER
What's in a Number? Analyzing Smoking Statistics
Sixth and seventh graders analyze smoking statistics. In this health lesson, learners look at the percentage of people who smoke from each race group. They create a bar graph and circle graph that displays this information.


