Curated OER
Measures of Central Tendency
In this measures of central tendency worksheet, students solve and complete 6 different problems. First, they count the number of items in each set of data. Then, students determine the mean, median and mode for each. In addition, they...
Curated OER
Cumulative Frequency - Mental Tests
In this measures of central tendency activity, quick-thinking pupils use mental math to find the mean, median, and range of samples. They use mental math to calculate subtraction problems. They complete 20 problems in which the answers...
Curated OER
Find Minimum and Maximum
In this number range activity, students solve 21 problems in which a series of five numbers is analyzed. Students record the minimum and maximum numbers. There are no examples.
College Board
Extrema
No need to go to extreme lengths to find resources on extrema. The central focus of an AP® curriculum module is on critical points and extrema, and how to cover these concepts throughout the course. A set of three worksheets helps assess...
Curated OER
All in the Family
Students use data to make a tally chart and a line plot. They find the maximum, minimum, range, median, and mode of the data. Following the video portion of the lesson, students will visit a Web site to test their data collection skills...
Curated OER
How Big Is Your Head?
Students explore measurement by measuring classmates' heads. They record their measurements and they put the measurements in order from smallest to largest. Students figure the mean, median, mode, maximum, minimum, and range of their...
Curated OER
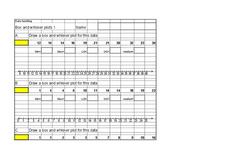
Box and Whisker Plots
Seventh graders explore the concept of box and whisker plots. In this box and whisker plots lesson, 7th graders plot data on a box and whisker plot. Students discuss the mean, median, and mode of the data. Students discuss range,...
Curated OER
Introduction to Representing and Analyzing Data
Represent data graphically. Allow your class to explore different methods of representing data. They create foldables, sing songs, and play a dice game to reinforce the measures of central tendency.
Curated OER
Reaction Time
Students record reaction time data and calculate minimum, maximum, mean, median, and mode. They participate in a class reaction time activity, observe and conduct an online experiment, and discuss and analyze the activity results.
Curated OER
Regents Exam Questions: Domain and Range 1
In this domain and range worksheet, students examine functions and identify the range of a function. They find the maximum and minimum value of a function. This two-page worksheet contains 7 multiple-choice problems. Answers are...
Curated OER
Box and Whisker Plots
In this math worksheet, students compute the median of sets of numbers. They create box and whisker plots. Students identify the median, upper and lower quartiles, and minimum/maximum amounts. On the last page of this worksheet, students...
Statistics Education Web
Now You SeeIt, Now You Don't: Using SeeIt to Compare Stacked Dotplots to Boxplots
How does your data stack up? A hands-on activity asks pupils to collect a set of data by measuring their right-hand reach. Your classes then analyze their data using a free online software program and make conclusions as to the...
Curated OER
What Temperature Is It?
Students use the internet to research information on the average maximum and minimum temperature for a city in their state. They create spreadsheets and enter data to analyze the information, focusing on averages, maximums, minimums and...
Curated OER
Statistics
In this statistics worksheet, 7th graders solve and complete 5 different problems related to determining various statistics. First, they find the average of a given set of numbers. Then, students find the median and mode of each set of...
Curated OER
Scatterplots
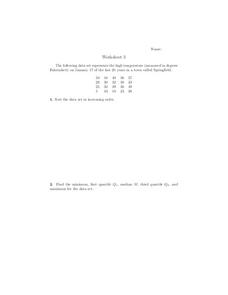
For this scatterplots worksheet, 9th graders solve and complete 6 different word problems with different sets of data. First, they sort the data set in increasing order and find the minimum, first quartile, median, third quartile, and...
Curated OER
Main Idea in Informational Text
Individuals complete a pre-assessment to gauge their ability to determine the main idea and supporting details in nonfiction text. They examine a new piece of nonfiction reading by looking at the table of contents, headings, and index...
Willow Tree
Extremes, Range, and Quartiles
The middle of the data is important, but what about the rest of it? The lesson shows learners the importance of the range, quartiles, and extreme values. Pupils practice finding each of these values from given data sets.
3Dme Pty
Alcohol and Your Brain
Through an engaging video and quiz, learn about the effects of alcohol on specific regions of the brain, as well as general effects on the body.
Willow Tree
Box-and-Whisker Plots
Whiskers are not just for cats! Pupils create box-and-whisker plots from given data sets. They analyze the data using the graphs as their guide.
Inside Mathematics
Archery
Put the better archer in a box. The performance task has pupils compare the performance of two archers using box-and-whisker plots. The resource includes sample responses that are useful in comparing individuals' work to others.
Curated OER
Home is the Place
Students apply the concepts of computation, area/perimeter; maximum/minimum; percentage; statistics; and scale drawings to a real world situation. They plan their dream home within a given set of constraints such as budget and zoning.
Curated OER
Rotation Velocity of a Galaxy
In this orbit of stars in galaxies worksheet, students are given an equation that models the orbital speeds of stars as they relate to their distance from the nucleus of a galaxy. Students solve 5 problems using this equation and...
Curated OER
Main Idea in Informational Text
Readers identify main ideas and supporting details using informational texts. In this literacy lesson, they make predictions and read the text to find the main ideas. They use a table diagram to define the main idea and supporting...
Curated OER
Similarities and Differences in Properties of Different Families of Functions - An Investigation
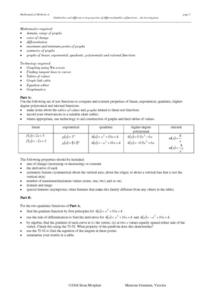
Exploring families of functions allows students compare and contrast properties of functions. Students discuss properties that include symmetry, max and min points, asymptotes, derivatives, etc.


