Curated OER
Mapping My Trip to the 2002 Winter Olympics!
Eighth graders map their route from their local community to Salt Lake City, Utah for the Winter Olympics. Using atlases, they gather topographical information and use the internet to research any landmarks they might pass on the way....
Curated OER
Mapping West Virginia
Fourth graders explore West Virginia. In this Unites States geography lesson, 4th graders discuss the type of land and the cities in West Virginia. Students create two overlays, with transparencies, that show the natural land and the...
Curated OER
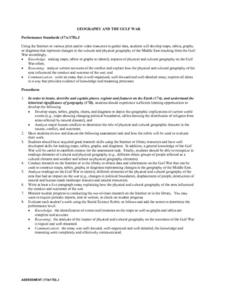
Geography And The Gulf War
Students develop maps, tables, graphs, charts, and diagrams to depict the geographic implications of current world events, and analyze major human conflicts to determine the role of physical and cultural geographic features in the...
Curated OER
Mapping The Ocean Floor
Young scholars explore and analyze the bottom structure of underwater habitats. They describe and explain what can't see through the collection and correlation of accurate data. Learners assess that technology is utilized as a tool for...
Curated OER
Geography Skills
Students practice their geography skills. In this geography skills lesson, students locate, plot, and label places on maps and globes.
Curated OER
Bias in Statistics
Students work to develop surveys and collect data. They display the data using circle graphs, histograms, box and whisker plots, and scatter plots. Students use multimedia tools to develop a visual presentation to display their data.
Curated OER
How Do I Get There? Planning a Safe Route to School
One much-needed skill for young learners is direction giving. Have your class plan and draw a safe route for them to travel from home to school. They will also draw places and items that are in between home and school in order to build a...
Curated OER
Shadows and Skyscrapers
Eighth graders explain the relationship between the position of the sun, a city's latitude and shadow length. Ratio's, geometry, and algebra are used to determine the shadow lengths and building heights. A sun angle (altitude) charts to...
Curated OER
Exploring Wyoming Species Habitats
Learners are introduced to the concept of species habitats and ranges. They introduced to ArcView GIS as a tool for mapping. Pupils use query data for species withina county, elevation, range, rivers and streams, land cover, and etc....
Curated OER
Using Non-Text Features
Second graders examine graphs and charts from their local newspaper. As a class, they discuss what the data means and how it relates to the article. In groups, they are shown two sets of graphs or charts and they practice explaining...
Curated OER
Local Traffic Survey
Students conduct a traffic survey and interpret their data and use graphs and charts to display their results.
Curated OER
Population and Population Density
Students read and interpret graphs. For this population lesson, students explore population and population density as they read several data graphs and respond to questions.
Curated OER
COLONIAL FLYERS/TRAVEL BROCHURES TO THE COLONIES
Students investigate concepts of history and geography in this activity. They create travel brochures for travelers who are crossing the Atlantic Ocean to populate the colonies of early America. The brochure has topographical information...
Curated OER
The Lake Effect
Fourth graders conduct an experiment demonstrating the effects of water and air temperature on precipitation. They create graphs demonstrating their findings using Claris Works for Kids.
Curated OER
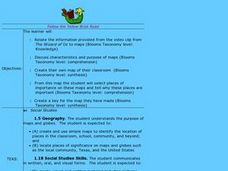
Follow the Yellow Brick Road
Students watch a portion of "The Wizard of Oz" and discuss how a map could be useful to Dorothy. They identify key components of maps and design a map of their classroom, including a key.
Curated OER
Facts, Fictions and Perceptions of Regions
Students examine the different characteristics of the regions of the United States. They discuss places they have visited in the U.S., and in small groups conduct research on a selected region of the U.S. Each group labels a map of...
Curated OER
Indian Resistance
Students observe the pictures and maps of the Sequoyah Indians. In this Sequoyah lesson plan, students use the maps and pictures to discuss observations and write responses of the Indian point of view.
Curated OER
A Class Census
Students recognize that data represents specific pieces of information about real-world activities, such as the census. In this census lesson, students take a class and school-wide census and construct tally charts and bar graphs to...
Curated OER
Mapping Your Community
Students define the boundaries of their community by comparing the community's official boundaries with other historical, political, physical, and perceived boundaries of the area and create a community map.
Curated OER
Mapping Possible Solutions
Fourth graders propose possible sites for the heart of Florida state capital by mapping collected data onto a Florida state map and recording data in a Travel Log.
Curated OER
Mapping the Ocean Floor
Students study the bottom structure of underwater habitats and how they can be mapped.
Virginia Department of Education
Functions 1
Scholars learn what it means for a relation to be a function and see various representations of functions. After learning the definition, they participate in a card sorting activity classifying relations as functions or not.
Curated OER
How Far Did They Go?
Students create a map. In this direction and distance instructional activity, students come up with familiar places in the community and calculate the distances from these places to the school. Students create a map that displays these...
Other popular searches
- Maps Graphs and Charts
- Graphs, Charts and Maps
- Graphs\, Charts and Maps
- Charts, Graphs, Maps
- Maps, Charts, Graphs, Tables


