Curated OER
Lights, Shoals & Soundings
Students explore nautical charts and their symbols, with a bit of fun thrown in.
Curated OER
Unit VII Energy: WS 1 Qualitative Analysis - Pie Charts
For each of eight diagrams of objects in motion, physics masters draw pie charts to depict the changes in energy. For each they must identify the energy conditions at each position. This is a unique worksheet, perfect for assessing how...
Curated OER
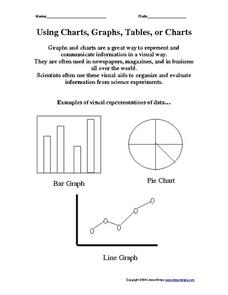
Using Charts, Graphs, Tables, or Charts
For this charts, graphs and tables worksheet, students view 3 different types of visual representations of data, make a list of 20 items and decide how the items can best be put together in groups to make a graph, chart or table....
Beyond Benign
Municipal Waste Generation
Statistically, waste may become a problem in the future if people do not take action. Using their knowledge of statistics and data representation, pupils take a look at the idea of waste generation. The four-part unit has class members...
Curated OER
What Came From Where?
Pupils research patterns and networks of economic interdependence. They work cooperatively to create 3-dimensional representations of common objects and charts describing the objects' components and countries of origin. Students identify...
Curated OER
Climate Comparison Charts
In this comparing climate charts worksheet, young scholars record average monthly temperatures and average monthly precipitations on two charts. Students record twenty-four monthly statistics.
Howard Hughes Medical Institute
Patterns in the Distribution of Lactase Persistence
We all drink milk as babies, so why can't we all drink it as adults? Examine the trend in lactase production on the world-wide scale as science scholars analyze and interpret data. Groups create pie charts from the data, place them on a...
Laboratory for Atmospheric and Space Physics
Charting the Progress of New Horizons
In 2006, New Horizons began its mission to fly to Pluto. As it continues its journey, scholars track its progress with the help of an informative website, all the while reinforcing measurement concepts with the construction of a scaled...
Curated OER
Solar Storm Energy and Pie Graphs
In this solar storm energy and pie graphs worksheet, students solve 5 problems using pie graphs that show the amount of solar energy that is converted into radiation, kinetic energy, flare energy and flare energy that is lost to working...
Curated OER
The Great Pollinators
Students discover the reproductive parts of a plant. In this biology lesson, students identify and categorize several different plants they dissect in class. Students record their information using a data chart.
Curated OER
Earth Energy Budget Pre Lab
Learners explore energy by conducting an in class experiment. In this climate change lesson, students conduct a water vapor experiment in a soda bottle. Learners utilize graphs and charts to analyze the results of the experiment and help...
Curated OER
Games on Echolocation
Get a little batty with life science! This fun simulation game replicates how bats use echolocation to hunt moths in their native Hawaiian habitat. After creating blind folds and discussing some basic principles of echolocation, students...
Curated OER
Weather Instrument Data Chart 2
In this science worksheet, students look for the data that is needed to fill in the graphic organizer. The prefixes are given that are needed to sort the information as it is collected.
Curated OER
Physical Science: Festival of Bubbles
Investigate bubbles through the use of scientific inquiry. Pupils blow bubbles using several methods and measure the resulting bubble print. Measurements are recorded on a data table and transferred to a bar graph. Results are discussed...
NASA
Seasonal Science: Building Claims from Evidence
A lot can change in a year! Investigators observe a video of Earth over the course of a year and complete a KWL chart. Astronomers view a second video, participate in a guided discussion, and discuss the rubric for successfully...
Curated OER
Navigation Across the Seas
Students examine nautical navigation and discover the differences between nautical charts and other types of maps or charts. Students practice setting a course, taking a bearing, and dead reckoning. This gives students an example of...
Curated OER
Reading Charts and Tables - Garden Spiders
Students complete chart and table reading activities to learn about garden spiders. In this chart and tables lesson, students view a video about garden spider varieties. Students name the different spiders and complete a spider garden...
Curated OER
Charting Evaporation
Learners observe the concept of evaporation. In this evaporation lesson plan, students observe this by either charting as the sun evaporates water over time, or watching a boiling pot steam.
Curated OER
Chart Making for Navigators
Students discuss the importance and function of nautical maps for sailors. They, in groups, take soundings of a simulated bay in a shoebox and develop a nautical chart that enable them to navigate the shoebox safely.
Curated OER
Color Mixing
Students experiment with primary colored water to mix new colors. They record new colors on a simple data sheet and share opinions on their work.
Curated OER
Stars and Constellations
Ninth graders investigate how ancient cultures viewed their world in terms of astronomy. They read and discuss an informational handout, construct an astrolabe, and locate stars and constellations using star charts.
Curated OER
Discovering Mitosis in Onion Roots
High schoolers discover the different stages of mitosis by examining onion roots under a microscope, drawing diagrams of what they see, and organizing collected data in a chart and create a pie graph from their lab data.
Curated OER
Tables, Charts and Graphs
Learners examine a science journal to develop an understanding of graphs in science. In this data analysis lesson, students read an article from the Natural Inquirer and discuss the meaning of the included graph. Learners create a...
Curated OER
Weather Instrument Data Chart
In this science worksheet, young scholars look for the answers to the correct place on the data chart. They organize and make interpretations of the data.
Other popular searches
- Charts and Graphs
- Multiplication Charts
- Maps and Charts
- Tally Charts
- Pie Charts and Graphs
- Pie Chart
- Multiplication Charts to 100
- Reading Charts and Graphs
- Behavior Charts and Graphs
- Charts and Graphs Candy
- Interpret Charts and Graphs
- Charts and Graphs Christmas


