Curated OER
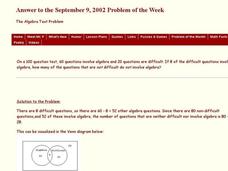
The Algebra Test Problem
In this algebra test worksheet, students construct and interpret a Venn Diagram. They determine the type of algebra problems designated in the Venn Diagram. This one-page worksheet contains 1 problem. The answer is...
Curated OER
Creating Bar Graphs and Pie Graphs
Second graders observe a demonstration of the creation of a bar graph and a pie graph of their favorite colors. They gather information about various topics from their classmates, then organize the information, creating a bar and a pie...
Curated OER
Creating Pie Graphs Using Percents
Sixth graders examine how to convert fractions to percents and percents to fractions. They list their activities for a 24 hour period, and create a pie graph using Microsoft Works.
Curated OER
Timed Multiplication Test Graphs
Students use the tools of data analysis for managing information. They solve problems by generating, collecting, organizing, displaying histograms on bar graphs, circle graphs, line graphs, pictographs and charts. Students determine...
Curated OER
Spreadsheet Graphs
Students create graphs using information from spreadsheets. They select a topic from the following choices: website use, digital cameras, spreadsheets, calculators or educational software. They tally the class results and create an...
Curated OER
"Graph It"
Students work in teams to conduct short surveys of their classmates. They show their results using at least two different types of graphs.
Students separate into teams and are asked that each team to choose something that they are...
Curated OER
Graphing Data
Second graders examine how to make and read bar graphs. For this bar graph lesson, 2nd graders compare bar graphs to pictographs by looking at hair color survey data. They practice making a bar graph and finding the range of the data.
Curated OER
Investigating: Interpreting Graphs and Analyzing Data
Students explore statistics by researching class birthday data. In this data analysis lesson, students investigate the different birthdays among their classmates and create data tables based on the given information. Students view bar...
Curated OER
Meet The Graphs
Students identify two types of graphs. They analyze and interpret authentic data shown in bar and pie graphs and complete a graph given specific data. Perform simple functions within an Excel document:
Curated OER
Usage and Interpretation of Graphs
Students review graphing and use processing skills to solve problems.
Curated OER
Charting Attendance Rate of Busch Gardens
Sixth graders, in groups, are given different parts of the whole project. They use information from Busch Gardens to explore line graphs, averages, and other math vocabulary.
Curated OER
Bald Eagle Population Graphing
Students create graphs to illustrate the bald eagle population. They identify the population of bald eagles in Minnesota and the United States. They create three graphs to represent the population data including a line, bar, and...
Curated OER
Tally Charts
In this tally charts worksheet, students fill in the tally chart with the item, tally, and number. Students have 2 tally charts to complete.
Curated OER
Charting Weight
Sixth graders record the weight of themselves and 3 family over a week, and then use that data to compile 2 bar graphs and 4 line graphs and answer a series of questions.
Curated OER
Graphing Pockets
Second graders explore graphing. They count the number of pockets on their clothes and use Microsoft Excel to enter their data. Students create a class graph displaying their findings.
Curated OER
Pet Count Excel Graphing
Students used collected data to distinguish what pets they have or would like to have. They correlate findings with appropriate technology--Excel. At the end of the lesson they tabulate a bar chart and present their findings to the class.
Curated OER
Responding to A Sound of Thunder by Writing PowerPoint Presentations
Students, after reading "A Sound of Thunder," create a PowerPoint presentation about time travel. They study and utilize a graphic organizer to assist them in preparing to deliver an oral presentation next and finally they print their...
Curated OER
Let's Learn About Firefighters!
Students explore, analyze and study about fire fighters and fire safety. They listen to a book, list what they already know about firefighters and fire safety rules and compare/contrast types of firefighters. Each student then writes a...
Math Moves U
Collecting and Working with Data
Add to your collection of math resources with this extensive series of data analysis worksheets. Whether your teaching how to use frequency tables and tally charts to collect and organize data, or introducing young...
Santa Barbara City College
How to Make a Multiplication Table
Teach children how to make a multiplication table, and they'll be multiplying for life. Following this series of steps, young mathematicians learn to use patterns and the relationships between numbers to create...
PBS
The Lowdown — U.S. Gun Homicides: Visualizing the Numbers
Is gun violence a big issue in America? Pupils explore gun deaths by type, race, and age group in a Math at the Core: Ratios interactive. The class tries to determine whether America is a safe place to live and use bar graphs and pie...
Polar Trec
Beacon Valley Weather
In Beacon Valley, katabatic winds regularly knock fit adults to the ground. The lesson compares the actual temperatures to the wind chill after factoring in katabatic winds in Beacon Valley. Scholars learn to calculate wind chill and...
Curated OER
Data Collection and Presentation
Middle and high schoolers collect and analyze data from four different activities. The activities include information about classmates, tallying colors of cars in a parking lot, stem and leaf plots, and making a histogram from...
CPO Science
Science Worksheets
If you need an array of worksheets to augment your science lessons, peruse a collection of assignments that is sure to fit your needs. With topics such as metric conversion, the scientific method, textbook features, research skills,...
Other popular searches
- Pie Charts and Graphs
- Reading Charts and Graphs
- Behavior Charts and Graphs
- Charts and Graphs Candy
- Interpret Charts and Graphs
- Charts and Graphs Christmas
- Charts and Graphs Math
- Analyzing Charts and Graphs
- Tables, Charts and Graphs
- Charts and Graphs Europe
- Using Charts and Graphs
- Bar Graphs and Charts


