Curated OER
Create a Graph Online
Scholars create colorful bar, line, or pie graphs. They decide on a survey question to ask or a type of data to gather. From there, they collect information and data. They display this data in bar, line, or pie graphs that they create...
Curated OER
Basic Algebra and Computers: Spreadsheets, Charts, and Simple Line Graphs
Young scholars, while in the computer lab, assess how to use Microsoft Excel as a "graphing calculator." They view visual representations of line graphs in a Cartesian plane while incorporating basic skills for using Excel productively.
Curated OER
Graphing With Candy
Students gather information and interpret the results using a tally chart, a table, and a bar graph.
Curated OER
Then and Now
Students conduct research and use census data to compare different times and places. In this census lesson, students interpret data from charts and graphs, comparing census information from two time periods as well as from two different...
Curated OER
Data! Data! Graph that Data!
Fifth graders create data graphs using Microsoft Excel. In this data collection lesson, 5th graders create and conduct a survey, then use Excel to organize and graph their data.
Curated OER
Graphing on the Computer
Students create a bar graph on the computer using given information from the teacher. They create a bar graph using their own information chart (they need to create one on separate paper first). They utilize Microsoft Excel for this...
Curated OER
EXCEL It!
Students surf the Web gathering information about graphs. The data collected is incorporated into an Excel spreadsheet and graphs of varying nature generated to further enhance student understanding.
Curated OER
Great Graphing
Students collect data, use a computer spreadsheet program to create various graphs, and compare the graphs. They state the findings of each graph in writing and decide which graph type best represents the data.
Curated OER
Graphing Using Excel
Fifth graders complete a series of graphs by gathering information and using Excel to graph the information. In this graphing lesson, 5th graders graph favorite desserts of the class. Student put their results into the computer and then...
Curated OER
Excel temperature Graphs
Students gather data about the weather in Nome, Alaska. In this Nome Temperature lesson, students create an excel graph to explore the weather trends in Nome. Students will find the average weather and add a trend line to their graph.
Curated OER
M&M Graphing
Fourth graders name colors of M&Ms and record answers. They estimate number of M&Ms of each color found in a typical package of M&Ms on piece of paper.They record information on sheet of paper and create a spreadsheet. paper.
Curated OER
Graphing Family Reading Habits
Second graders collect data from their families about their reading habits and graph them. For this graphing family reading habits lesson, 2nd graders interview family members about their reading habits. They then use a graphing computer...
Curated OER
Countdown to Disaster
Students discover the potential dangers of weather in their hometown. In this environmental lesson, students research Hurricane Hugo and the devastation it caused South Carolina in 1989. Students record weather data from their city and...
Curated OER
MAISA and the REMC Association of Michigan
Students complete online research to study geography's impact on weather. In this geography and weather lesson, students research weather in their city for ten days using an online website. Students bookmark the site, enter data into a...
Curated OER
Electronic Spreadsheets & Iditarod 2000
Students use the Internet for gathering information for Iditarod race journals. They use a spreadsheet program for entering data and making charts for showing changes in speeds achieved over a period of four weeks in timed writings in...
Curated OER
Migration of the Neo-Tropical Songbirds
Fifth graders plot the migration of birds using Google Earth. In this lesson on bird migration, 5th graders work in groups to plot the migration of a group of birds using Google Earth. Students present and discuss their findings and look...
Curated OER
Patterns Here, There, and Everywhere!
Upper graders access the Microsoft Word program and create patterns by utilizing certain keys on the keyboard. They create picket fences, smiley faces, and hearts. It seems that this lesson has as much to do with keyboarding skills as it...
Curated OER
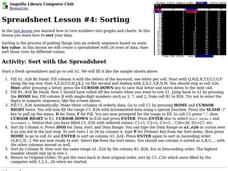
Sorting
Learners examine how sorting is the process of putting things into an orderly sequence based on some key value. In this lesson students create a spreadsheet with 26 rows of data, then sort those rows by different values.
Curated OER
Help! I Need Five Minutes to Study
Learners learn to use a time grid or a calendar to increase productivity of their studying. In this studying lesson, students record how they spend their studying time and then adjust as needed. Learners recognize various ways to...
Curated OER
Seaside Science
Learners research sea life using laptop computers. In this sea life lesson plan, students participate in a field trip to the beach and enter observations into their laptop computers. Learners classify shells and sea life.
Curated OER
Planet Protectors
Students explore ways to protect the earth. In this environmental issues and technology activity, students investigate the water quality in their community and compare their findings to the water quality in other geographic areas. ...
Curated OER
The Nutrients Public Transportation System
Students investigate the human circulatory system by experimenting with hoses. In this human body instructional activity, students create a system of hoses simulating the circulatory system which they utilize to pass objects through....


