Georgia Department of Education
The Basketball Star
Have learners use math to prove they are sports stars! Assess a pupil's ability to create and analyze data using a variety of graphs. The class will be motivated by the association of math and basketball data.
Curated OER
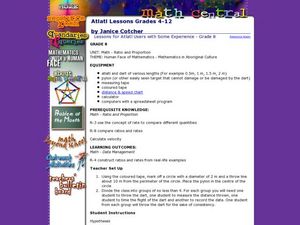
Atlatl Lessons for Grade 8
Eighth graders explore the weapons of the Aboriginal people. In this eight grade math/science lesson, 8th graders collect and analyze data regarding the speed and distance of a dart thrown with an atlatl. Students choose the...
Curated OER
Bar and Histograms (What Would You Use: Part 1)
Students practice creating bar graphs using a given set of data. Using the same data, they create a group frequency chart and histograms. They must decide the best graph for the given set of data. They share their graphs with the...
Curated OER
The Classroom Desk Graph
Second graders choose the appropriate measuring tool by discussing a tool to measure contents in desks. They then use a scale to weigh contents in desks.
Next, they study standard units of measurement by writing down the weight in...
Curated OER
Data Collection - Primary Poster
Students explore the concept of collecting, analyzing, and graphing data. In this collecting, analyzing, and graphing data lesson, students create a survey about a topic of interest. Students poll their classmates, analyze, and graph...
Curated OER
Weather "Whys"
Students explore the weather. In this weather data activity, students collect weather data from Internet and media sources. Students graph the collected data discuss it as well as the seasons of the year.
Curated OER
Looking for More Clues
Fifth graders explore how to collect data and display it on a bar and circle graph.
Curated OER
Creating a Bar Graph with a Graphing Program
Young scholars use the S'COOL data base to create a bar graph.
Curated OER
Rainbows, Bridges & Weather, Oh My!
Explore how real-world applications can be parabolic in nature and how to find quadratic functions that best fit data. A number of different examples of modeling parabolas are explored including a student scavenger hunt, the exploration...
Curated OER
Creating Line Graphs
Learners draw line graphs. In this math instructional activity, students interpret minimum wage data and graph the data in a line graph. Learners predict the next minimum wage and figure the earnings for a 40 hour work week for someone...
Curated OER
Statistics: Reading and interpreting production graphs
Students interpret and create different types of graphs. They analyze data from charts, develop a survey and design appropriate graphic illustrations and make a presentation.
Curated OER
Fun With Graphs
Students create a hands-on graph then complement this by making a computerized version of the same graph using Graph Club. They read various graphs, so as to be more prepared for state exams which require this concept.
Curated OER
Graphing Valentine Candies
Fifth graders organize and display information in bar graph form using appropriate labels. Each student receives a box of Valentine heart candies, a worksheet of the tally chart and a worksheet of the bar graph.
Curated OER
Spreadsheet Graphs
Students create graphs using information from spreadsheets. They select a topic from the following choices: website use, digital cameras, spreadsheets, calculators or educational software. They tally the class results and create an...
SeaWorld
Marvelous Manatees
Here is an interesting activity on the manatee for your upper graders or middle schoolers. A game is played where learners work together to complete a successful manatee migration. It's a board game, and all of the game components are...
Curated OER
Congruent Rectangles
Very simply, geometers examine a pair of rectangles on graph paper and find a translation and rotation to demonstrate their congruence. A couple of questions follow to stimulate critical thinking about other possibilities.
Curated OER
Let Me Tell You About My State
State reports can be a lot of fun, especially when the learners get to choose the state they study. This research and writing-focused social studies instructional activity engages learners in collecting information, essay structure,...
EduGAINs
Introduction to Solving Linear Systems
Word problems offer class members an opportunity to learn the concept of solving linear systems using graphs. Individuals choose a problem based upon preferences, break into groups to discuss solution methods and whether there is...
Curated OER
What Does It Eat?
Young scholars use crickets, mealworms, and pill bugs and observe what they choose to eat. In this science lesson plan, students record data, create graphs, and do a write up on what they see happening.
Curated OER
Basketball Bounces, Assessment Variation 2
This un-scaffold summative assessment tasks learners to use the height of a bouncing basketball, given the data in graph and table form, to choose the model that is represented. Learners then use the model to answer questions about the...
Illustrative Mathematics
Coffee by the Pound
This is a great exercise in graphing proportional quantities to interpret the unit rate as the slope of a graph. It is not easy for learners to understand what a unit rate is. When it is presented as the slope of a linear line graph,...
Curated OER
Zoobilation
Youngsters become familiar with zoo animals. They sort them into categories, and choose an animal to act out. Two zoo centers are created in the classroom that have examples of the animals for the pupils to play with. Then, they choose...
Curated OER
Basketball Bounces, Assessment Variation 1
This highly scaffolded, summative assessment tasks learners to choose the model that represents the height of a bouncing basketball given the data in graph and table form. Learners then use the model to answer questions about the...


