Curated OER
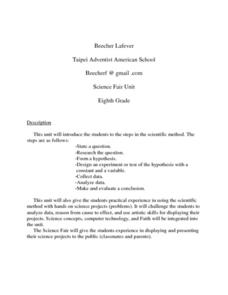
Science Fair Unit
Eighth graders explore the scientific method. After choosing an approved science fair project, 8th graders go through the scientific method process. Students gather information to analyze data and evaluate a conclusion. They write a...
Curated OER
Don't Trash the Earth
Middle schoolers experience a hands-on environmental science project. They access about recycling as they collect data on their own family's trash production. Students analyze the data with worksheets, chart the data, and present their...
Curated OER
Bodacious Buttons
First graders graph a data set. Given a set of buttons, 1st graders sort them into categories using specific attributes. They graph the number of buttons in their set based on their attributes using a variety of graphs. Students share...
Curated OER
Animal Species Richness in Tioga County, PA
Pupils compile an extensive list of animal species seen throughout Tioga County. In this data collecting lesson, students report daily any animal species seen during the course of their travels and adventures outdoors in Tioga County for...
Curated OER
Circle the Earth - Explore Surface Types on a Journey around Earth
Students use CERES percent coverage surface data with a world map in locating landmasses and bodies of water at Earth's Equator.
University of Georgia
Energy Content of Foods
Why do athletes load up on carbohydrates the evening before a competition? The lesson helps answer this question as it relates the type of food to the amount of energy it contains. After a discussion, scholars perform an experiment...
National Wildlife Federation
Citizen Science to the Rescue!
You don't have to be a scientist or even out of high school to contribute to scientific research. In the 12th lesson plan in the series of 21, scholars use this opportunity to add to the growing body of scientific knowledge and consider...
Foundation for Water & Energy Education
How is Flowing Water an Energy Source? Activity A
Here is a fun little exploration of the potential energy potential of falling water. Learners drop water from various heights using a straw, and they analyze the diameter of the splash. Pair this with two more activities of the same...
Curated OER
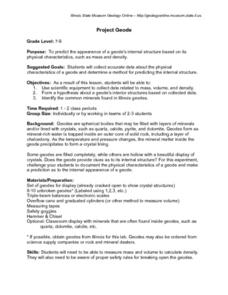
Project Geode
Young geologists attempt to predict the appearnace of a geode's internal structure based on how it looks from the outside, its mass, and its physical characteristics. In this geologly lesson, learners use scientific equipment to collect...
Cheetah Outreach
Population Change
Your youngsters become cheetahs in search of food, water, shelter, and space in a fun physical game that does a fantastic job of representing fluctuating species population based on resources available over years.
Foundation for Water & Energy Education
How is Flowing Water an Energy Source? Activity B
Explore the world's water without leaving the classroom! In this second of three uncomplicated but wonderful activities, physical science learners feel the pressure of water. They discover that the deeper the water, the stronger the...
Curated OER
Predicting Monthly Precipitation
Students should log onto, and collect data from, a specific site on the Internet. They average and compare the data using the Excel spreadsheet program, make predictions from their data, and determine the percent error of their predictions.
Curated OER
Discover Science
Students practice scientific research skills. In this lesson plan about science, students gain experience with the following skills: comparison, observation, identification, and data gathering. Students will go from station to station...
Curated OER
pH Testing
Students explore the use of variables in the scientific method. They identify the dependent and independent variables through pH testing. Students construct graphs of their data and analyze their findings.
Curated OER
School Lighting Audit
Learners identify the data included in an energy audit. They perform an audit on the lighting in their school building. They complete a worksheet and discuss lighting issues with school staff.
Curated OER
Hi, Deer!
Students collect, organize by table, and examine census data in a simulation, estimate the size of the population in the simulation and make predictions based on the collection of census simulation data.
Curated OER
Does Cloud Type Affect Rainfall?
Student uses MY NASA DATA to obtain precipitation and cloud type data. They create graphs of data within MY NASA DATA. They compare different cloud types as well as precipitation types. They describe graphs of the precipitation and cloud...
Curated OER
Specific Heat of Metals
Students determine the specific heat of unknown metals. based on their hypothesis and design proposal. They analyze the findings of the specific heat of the unknown metals. Students complete this by questions, hypothesis, rationale,...
Curated OER
Plate Tectonics Writing Assignment
Students complete a writing assignment focused on the use of data to support the theory of plate tectonics. They access data using the "Our Dynamic Planet" CDROM, capture images of the data plots, and incorporate them into their writing. T
Curated OER
Seasonal Cloud Cover Variations
Young scholars, in groups, access data from the NASA website Live Access Server regarding seasonal cloud coverage and the type of clouds that make up the coverage. They graph the data and make correlations between types, seasons and...
Curated OER
Sports Helmets and Impact Testing of Polymers
Students examine the importance of good quality safety gear. In this investigative lesson, students will tests various polymers, collect data, and analyze the data to determine which polymer is best for safety helmets. They will design a...
Curated OER
Water, Water Everywhere
Learners monitor a local creek. In this environmental water lesson, students conduct an environmental study of a local creek by monitoring the temperature and water quality over a period of time, then submit data to the Global Water...
Curated OER
The Tipping Point
Students rewrite word problems and solve using math. In this word problem lesson plan, students gather data and observe the data. They relate this process to the scientific method and math. They review their data to be able to answer...
Curated OER
Ocean Currents and Sea Surface Temperature
Students use satellite data to explore sea surface temperature. They explore the relationship between the rotation of the Earth, the path of ocean current and air pressure centers. After studying maps of sea surface temperature and ocean...
