Curated OER
Recording Treasure
Students participate in a garage sale. They will weigh the items sold. They will calculate the total weight of items sold and donated to an agency.
Curated OER
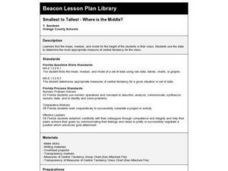
Smallest to Tallest - Where is the Middle?
Third graders measure each other's height and find the mean, median, and mode for the height of students in their class. They line up tallest to shortest and discuss the most appropriate measure of central tendency for the class.
Curated OER
Cinderbank
Fourth graders identify major components of a "Cinderella" story in order to create a database.
Curated OER
Let's Graph It!
Learners graph the height of others in centimeters and inches, find the slope of line in order to calculate the conversion factor between centimeters and inches.
Curated OER
Flying High in Math
Seventh graders study how real airplanes fly and then they construct models of paper airplanes using design resources for the Internet and their own design. They use meaurement and caluculations in order to help them construct their...
Curated OER
Hypothesis Testing: Top Ten Singles
Students review and better examine hypothesis testing and evaluation of probability distributions. the use of the discovery method is vital to the studying because it is about student interests which helps for motivation.
Curated OER
What's Your Favorite Stuffed Animal?
Second graders gather information in a survey and interpret the results using a tally chart, a table, and a bar graph. They' present their results of the during the final group discussion. The subject of the survey is favorite stuffed...
Curated OER
Valentine Hearts
Young scholars sort candy Valentine hearts into groups and create individual graphs.
Curated OER
Pumped Up Gas Prices
Students spend one month keeping track of the mileage and gasoline amounts they or their family has used. Information is entered into a spreadsheet to help calculate the average gas prices over time.
Curated OER
Graph Your Foot!
Students measure their own foot and place the outline on a graph. They make connections between the size of their foot and the bar graph that represents it.
Curated OER
Your Just Desserts
Middle schoolers write letters to town officials and local businesses asking for favorite dessert recipes. They tabulate their responses in a spreadsheet. Students turn their survey results into colorful graphs.
Curated OER
Chart Trivia
Students practice addition and subtraction problems and answer questions using greater than and less than. They chart information to create a graph on the computer.
Curated OER
You May Already Be a Winner!
Second graders flip coins and tally the outcomes. They play the You May Already Be a Winner! game with cards under their chairs. Some cards are winners, some might be and the others are not. They play to explain the probability concept.
Curated OER
How Do You Get Home from School?
First graders create pictographs and interpret results of transportation home from school.
Curated OER
Rodeo Round-Up
First graders create a graph of the various teachers' favorite events at the rodeo.
Curated OER
Go Yankees!
Students use the internet to research the New York Yankees baseball team. After gathering their information, they discuss the challenges faced by the team and how they were overcome. They end the lesson by examining the math and...


