Las Cumbres Observatory
Star In a Box
Stars may all look the same from down here, but their surfaces tell a different story. Using an animation, learners collect data about the temperature and luminosity of stars and compare them to their mass and radius. They then answer...
National Wildlife Federation
Who Can Live Here?
Not all species can survive in all habitats. Using specific criteria, learners assess the fitness of a local habitat to a specific species. They collect data and suggest enhancements to create a suitable habitat for their chosen species.
Teach Engineering
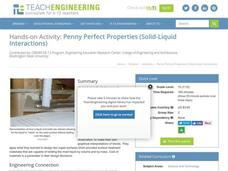
Penny Perfect Properties (Solid-Liquid Interations)
I can get more water to stay on a penny than you can! Collaborative pairs determine the volume of liquids that can be contained on the surface of copper pennies and plastic coins. The pairs analyze their results using graphs and go on to...
Pingry School
Gas Pressure and Volume Relationship
Do your high school scientists know the four methods scientists use to communicate information? A simple experiment discovering the relationship between gas pressure and volume allows pupils to practice all four. After completing the...
Science Matters
Electromagnets
Classes are sure to get all wrapped up in an attractive instructional activity! Young scientists learn how to combine electricity and magnetism as they create electromagnets. They create their own electromagnets and collect data on...
Curated OER
Voter Turnout
Students solve problems using math. They complete a graph, using data from the 2000 presidential election results. Students predict and calculate the outcome of the election based upon the voting patterns.
Curated OER
Fly Away With Averages
Learners discover the process of finding the mean, median, and mode. Through guided practice and problem solving activities, they use a computer program to input data and create a graph. Graph data is used to calculate the mean,...
Curated OER
Closing the Case
Fifth graders collect data and prepare data displays using a survey with statistical information.
Curated OER
Descriptive Statistics
Students demonstrate how to use frequency and scatter diagrams. In this statistics lesson, students are introduced to different techniques of representing data. Students sort and graph data on a worksheet and use a frequency diagram to...
Curated OER
Evaporation Experiment- Desert Science Graph
In this science worksheet, students make a bar graph about desert evaporation. The directions say to use the "data from your recording data page" to display information on the graph.
Curated OER
What's Your Line?
Fifth graders collect temperature readings over a period of time, enter the information into a spreadsheet and choose the appropriate graph to display the results.
Curated OER
Positive Future Fair Project
Ninth graders view the film "Pay It Forward" and discuss what kind of public campaign is needed to move people to positive action. They consider different ways of presenting information (graphs, visual displays, etc.) as tools for...
Curated OER
Chart This!
Students collect and analyze data. In this middle school mathematics lesson, students collect data on three to four traits or favorites. Students analyze their data and create a chart of graph for each trait or favorite they...
Curated OER
What's Your Favorite Season?
Students collect data on the favorite seasons. In this data collection and analysis lesson, students learn about displaying data on charts and graphs. They collect data about the favorite seasons of the children in their class and...
Curated OER
Bird Feeding and Migration Observation
Students research bird migration and build a bird house. In this bird lesson plan, students research the birds in their area and where they migrate to. They also build their own bird house and record data on what kinds of birds come to...
Curated OER
Do Not Open Until May 2000!
Students create a time capsule. In this time capsule lesson, students collect and record data about themselves to be stored in a time capsule that will be opened at the end of the year.
Curated OER
Using Diagrams in Problem Solutions
Students use tables, graphs and diagrams to collect data. For this problem solving with diagrams lesson plan, students construct their own tables and graphs containing information they gather from a drawing. They also make a Venn Diagram...
Curated OER
Acid-Base Titration
Students determine the concentration of an unknown solution. This task assesses students' abilities to state hypothesis, develop procedures for investigation, plan for recording and organizing observations and data, collect data, create...
Curated OER
Weather Patterns
Fourth graders collect and chart weather data over the course of the school year either using tools at school or media resources. They agree on weather terms to use in their observations and write them on the assigned sheet. Finally,...
Curated OER
Bouncing Ball Experiment
Students collect data for a bouncing ball and select one bounce to analyze. They explore the relationship between velocity, position and acceleration. They seek out connections between the graphs and the physical motion of the ball.
Curated OER
Questionnaires and Analysis
In this questionnaires and analysis worksheet, students design a questionnaire and then select a sample. They organize and analyze data. This four-page worksheet contains 1 multi-step problem. Explanations and examples are provided.
Curated OER
Results and Conclusions
Fourth graders practice using the scientific method. In this results and conclusions lesson, 4th graders review data collected, create a graph of their data and make their final conclusions about the information collected.
Curated OER
Bias in Statistics
Students work to develop surveys and collect data. They display the data using circle graphs, histograms, box and whisker plots, and scatter plots. Students use multimedia tools to develop a visual presentation to display their data.
Curated OER
Collecting And Fitting Quadratic Data
Students investigate the concept of using quadratic data to plot coordinates on a plane. They also apply the quadratic formula for a variety of problems with the help of a graphing calculator to draw the parabola for given coordinates.


