Curated OER
Graphs
For beginners to picture graphs this is the perfect resource. They analyze two bar graphs that break down data visually so scholars can actually count the number in each column. For the first, they fill in how many of each type of pet is...
Berkshire Museum
Camouflage!: Collecting Data and Concealing Color
Help young scholars see the important role camouflage plays in the survival of animals with a fun science lesson. Starting with an outdoor activity, children take on the role of hungry birds as they search for worms represented by...
Curated OER
Graphs that Represent Data Sets
These four scenarios all contain graphable data; can scholars match them to the correct bar graphs? All the data is in single-digit whole numbers. Some of the scenarios instruct kids to make a graph, while others don't. Clarify...
Jude Mphoweh
Graphs
Searching for worksheets to include in an elementary math series on bar graphs? Then look no further! This collection of materials has exactly what you need to ensure that your students get plenty of practice reading and analyzing...
Curriculum Corner
Chrysanthemum: Name Graphing
Let's graph the amount of letters in everyone's name in the class. Give the two-page sheet to class members to collect letter data and then translate their data into a graph.
Math Moves U
Collecting and Working with Data
Add to your collection of math resources with this extensive series of data analysis worksheets. Whether your teaching how to use frequency tables and tally charts to collect and organize data, or introducing young...
Curated OER
Learning to Read Graphs
What is your favorite pet? This is a great tool for youngsters just learning how to read and interpret graphs. There are four simple questions. Consider extending this activity by creating a class bar graph: how many learners have a dog,...
Curated OER
Learning to Read Graphs 2
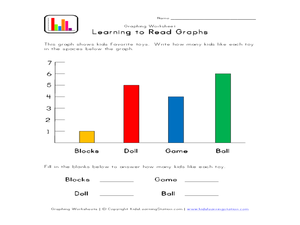
Do you like playing with blocks, dolls, games, or balls? Use this basic graph to review bar graphs with young learners. After completing the four questions below, consider creating your own class graph: who likes blocks the best? Who...
Curated OER
Graphs to Represent a Data Set
As your scholars begin to learn how to read graphs, help them pay attention to detail with this matching activity. They read four short data descriptions and match them to one of the four bar graphs pictured. Each graph is labeled along...
Curated OER
Walking the Plank
This is a cool math activity. Kids collect and interpret data based on a physical act. A board is balanced between a scale and a step, learners record a peer's weight as it decreases while s/he walks further away from the scale. They...
Curated OER
Graphs to Represent a Data Set
How many animals did Chaplin see at the zoo? Scholars examine three data sets and create a bar graph for each. Encourage them to label the different parts of their graphs, as this is not prompted on the worksheet. Once they finish their...
Curated OER
Data Collection and Presentation
Middle and high schoolers collect and analyze data from four different activities. The activities include information about classmates, tallying colors of cars in a parking lot, stem and leaf plots, and making a histogram from...
Math Worksheets Land
Pie or Circle Graphs—Step-by-Step Lesson
How do you display data that you've collected in a pie chart? Follow a clear step-by-step guide to turning survey results into a visible format. It shows kids how to determine the percentage of the whole that each section represents.
California Education Partners
Colorful Data
Scale up your lessons with a performance task. Young data analysts work through an assessment task on scaled bar graphs. They answer questions about a given scaled bar graph on favorite colors, analyze a bar graph to see if it matches...
Willow Tree
Bar Graphs
Circles, lines, dots, boxes: graphs come in all shapes in sizes. Scholars learn how to make a bar graph using univariate data. They also analyze data using those bar graphs.
Willow Tree
Circle Graphs
Pie isn't just for eating! Scholars learn to create pie charts and circle graphs to represent data. Given raw data, learners determine the percent of the whole for each category and then figure out the degree of the circle that percent...
Statistics Education Web
First Day Statistics Activity—Grouping Qualitative Data
Making groups of groups can help to organize data. Classes use statistics to group themselves using descriptive adjectives. The objective is for learners to understand that grouping qualitative data is useful when the original groups are...
Mathed Up!
Distance Time Graphs
If only there was a graph to show the distance traveled over a period of time. Given distance-time graphs, pupils read them to determine the answers to questions. Using the distance and time on a straight line, scholars calculate the...
Code.org
Good and Bad Data Visualizations
Good versus bad data. Pairs rate online collections of data representations from good to bad and then suggest ways to improve the visualizations. The class then creates a list of best practices and common errors in data representations...
Curated OER
Properties of a Good Graph
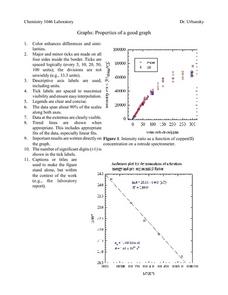
In this chemistry worksheet, students examine the common characteristics of an acceptable graph that is meant to be used to display data.
Balanced Assessment
Toilet Graph
Mathematics can model just about anything—so why not simulate the height of water in a toilet bowl? The lesson asks pupils to create a graphical model to describe the relationship of the height of the water as it empties and fills again....
Curated OER
Survey of Height
In this data collection instructional activity, students survey the heights of their fellow classmates, organize their data in a data table, and create a bar graph from their data. Once bar graph is completed, students complete 2 short...
Teacher's Corner
Brandon's Baseball Collection
Ten questions make up a activity that challenges baseball enthusiasts to read a graph then answer questions pertaining to the data's range, mean, median, and mode.
Noyce Foundation
Granny’s Balloon Trip
Take flight with a fun activity focused on graphing data on a coordinate plane. As learners study the data for Granny's hot-air balloon trip, including the time of day and the distance of the balloon from the ground, they practice...


