Curated OER
Twisters
Students differentiate between the terms 'tornado watch' and 'tornado warning' and simulate the conditions that produce tornadoes. They read "Night of the Twisters" by Ivy Ruckman and conduct an experiment using two-liter plastic...
Curated OER
Planet Research
Pupils recognize that the other eight known planets, which revolve around the Sun, have characteristics and surface conditions that are different from Earth; and identify examples of those differences.
Curated OER
Introduction to the Barnegat Bay Estuary
Students research estuaries. For this estuaries lesson, students discuss the differences in a bay and an ocean. Students watch a PowerPoint of the properties of the estuaries and geography of Barnegat Bay. Students complete a worksheet...
Curated OER
Nature's Air Conditioner
Students observe the process of transpiration in leaves. They measure how much water a leaf gives off in a 24-hour period, calculate the volume, and answer discussion questions.
Curated OER
A Cultural Palette
High schoolers examine pieces of music and art that represent who they are. They study Haitian culture and traditions by performing the musical production "Once on the Island." They watch and discuss the film "The Nature of Music."
Curated OER
Algebra, Multiplication, and Division of Fractions
Students gain knowledge by measuring time and distance for solving unknowns in an equation. They also will design an airplane and chance to communicate mathematically by writing essays.
Curated OER
Measuring and Identifying Trees with the Help of Technology
Students arrange themselves into small groups. Each group chooses a distance to measure ( the distance between the slide and the swings, for instance). Person #1 walks the distance, counting the number of his or her steps. Persons 2...
Curated OER
Gopher, Part 2: Gopherin'
Students explore how to access a gopher site using a root menu. Several options are presented with their definitions and the fastest routes examined in this lesson plan. The lesson plan is designed for librarians with little or no net...
Curated OER
Cloud Shadows
Young scholars classify clouds as transparent, translucent or opaque. They conduct an experiment to determine the visual opacity of several classroom objects and then conduct further observations of clouds.
Center for Innovation in Engineering and Science Education, Stevens Institute of Technology
Ciese Real Time Data Projects:collecting Weather Data and Keeping a Weather Log
Over a period of two weeks students will use their class-made instruments to measure and record weather data. Students will also compare their data to online weather data. The final activity involves analyzing the collected data to look...
Utah Education Network
Uen: Trb 4:2 Investigation 7 Interpreting Weather Data
After collecting weather data, 4th graders will interpret it.
Utah Education Network
Uen: Trb 4:2 Investigation 6 Collecting Weather Data
Students will Collect data, then make weather predictions from the weather patterns.
NASA
Nasa: Precipitation Towers: Modeling Weather Data
This lesson uses stacking cubes as a way to graph precipitation data, comparing the precipitation averages and seasonal patterns for several locations. Variations on the lesson can accommodate various ages and ability levels. Students...
Center for Innovation in Engineering and Science Education, Stevens Institute of Technology
Ciese Real Time Data Projects: Weather Scope: A Study of Weather and Climate
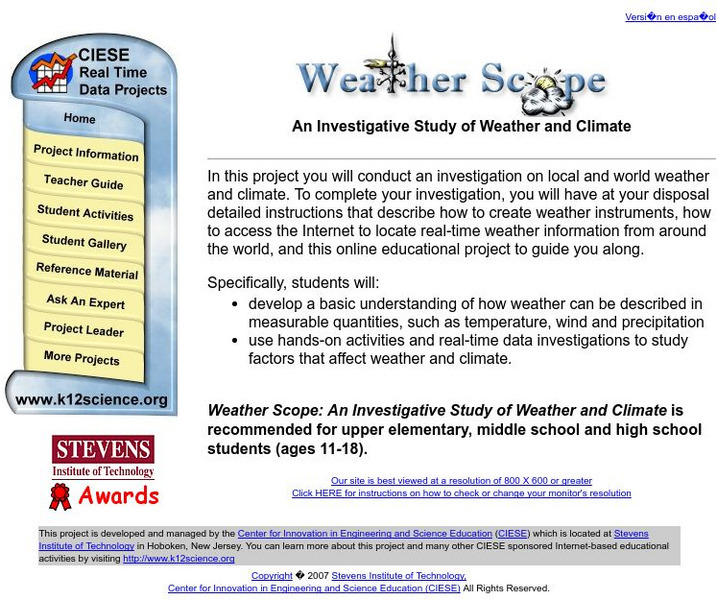
Use real-time data to study factors that affect weather and climate, create weather instruments, and share data with students around the world.
Center for Innovation in Engineering and Science Education, Stevens Institute of Technology
Ciese Real Time Data Projects: Building and Using Weather Instruments
In this lesson students will build and learn how to use three weather. They will use these instruments to collect weather data over a period of two weeks.
Center for Innovation in Engineering and Science Education, Stevens Institute of Technology
Ciese Real Time Data Projects: The Stowaway Adventure
Through this series of Internet-based learning experiences and activities, students will use real-time data to track a real ship at sea and monitor weather conditions. Includes a teacher's guide with problem-solving lesson plans...
Illustrative Mathematics
Illustrative Mathematics: Weather Graph Data
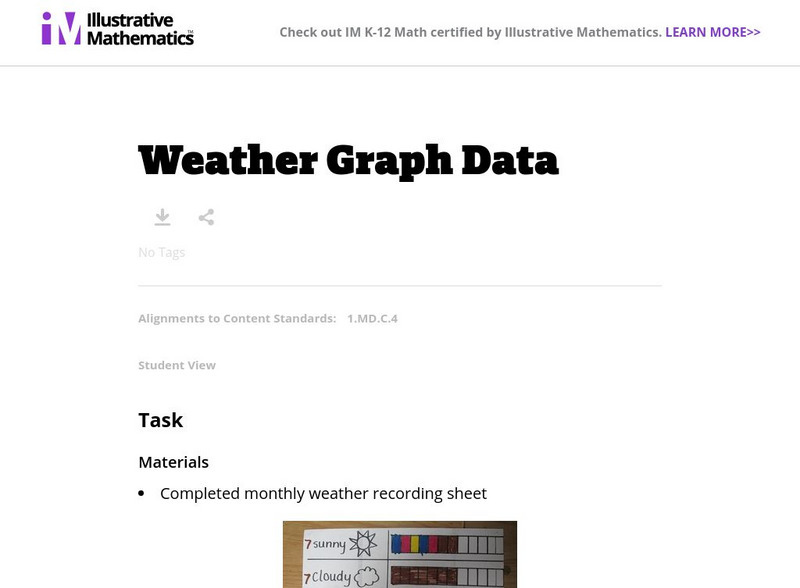
The purpose of this task is for students to represent and interpret weather data, as well as answer questions about the data they have recorded. Student worksheets and recording sheet are included.
Climate Literacy
Clean: Mauna Loa Co2 Collection Data
This data-intensive activity uses real world datasets to cover topics such as weather v. climate, air circulation around the globe, seasonal effects, and climate change.
University Corporation for Atmospheric Research
Ucar: Differences Between Climate and Weather
In this activity, students collect weather data over several days or weeks, graph temperature data, and compare the temperature data collected with averaged climate data where they live.
University Corporation for Atmospheric Research
Ucar: Project Sky Math
Teachers will be interested to explore the SkyMath module, and the 16 classroom activities at this site. In this program, students will collect and record real-time weather data to analyze. Data analysis, graphing, number relationship,...
Utah Education Network
Uen: Weather Walks
In this multi-day, young scholars will learn weather through multisensory approaches. Students will make daily predictions. After each daily prediction, they will collect measurement and observational data by taking walks in different...
Better Lesson
Better Lesson: Exploring Weather One, Two, Three, Forecast!
Learners will use weather data they collect to predict future weather. Included in this lesson are a weather forecasting recording sheet and an example of a student's completed work.
Alabama Learning Exchange
Alex: Weather Detectives
This is an introductory lesson to a second grade weather unit. The students will be observing the weather each day for one week and recording their observations in a chart. The students will be integrating information from the Internet...
Alabama Learning Exchange
Alex: Charting the Weather
During this activity, students will gather data from temperature and water gauges set up on the playground to learn about weather patterns. Then students will build a spreadsheet with data related to temperature, wind direction and...
