Curated OER
Basic U.S. Geography
Provide your 11th graders with a basic understanding of U.S. Geography. They label the state, regions, and boundaries found in the contiguous U.S. as well as Hawaii and Alaska. Then, they complete two Internet related activities.
Curated OER
Taking a Stand: Pros and Cons of Forest Fires
Students explore the pros and cons of forest fires. In this science lesson, students research the ecological implications of forest fires. Students record their findings in journals and compose a persuasive e-mail to government officials.
Curated OER
Terrific Tastebuds
Students investigate the four taste regions of the tongue. For this biology lesson, students view a diagram of a tongue and identify the four regions. Students perform a taste test with lemons, sugar, and crackers.
Curated OER
The History of Conflict in the Middle East
The history of the Middle East can be a fascinating and relevant topic for students.
Curated OER
Genetics
Students create a checklist of traits common in all of their families. Uisng a table, they compare and contrast their family members to non-family members. They also review dominant and recessive traits and discuss how knowing about...
Curated OER
Number The Stars
Students read a book about prejudices that occur in our daily lives. They describe characters in the book. Students discuss real life events of World War II and the Holocaust. Students simulate hiding Jews from the German soldiers. ...
Curated OER
Religions of the World
Second graders explore the part that religion plays in a culture. They explore how many different religions there are in the world and where they're located.
Curated OER
Nowhere to Run
In this environmental science activity, students explore the different climate change around the world and summarize them. They fill in the table provided.
Curated OER
Fells Point's Role in Shipping and Trade
Eighth graders examine the trade and military advantages of ships built in Fells Point. In this American History lesson, 8th graders analyze primary sources. Students create an encyclopedia of Fells Point.
Curated OER
Climate Control
Students explore the locations, characteristics, and natural and human dangers to the Earth's biomes to better explain the relationship between daily life and the environment.
Curated OER
Come Fly with Me
Students identify rhyming words from the book A Fly Went By by matching words written on index card with same endings, eliciting word when prompted by teacher, and by identifying rhyming words in the text.
Curated OER
Lowest Fertility Countries Quiz
In this online interactive geography quiz worksheet, learners respond to 20 identification questions about countries with the lowest fertility rates. Students have 3 minutes to complete the quiz.
Curated OER
Exploring Infrared Image Technology
Young scholars view infrared images of a blowing hair dryer, a Popsicle, and a toaster. They discuss the images and ways they are different than visible light images. Students view a temperature scale and discuss which parts of the item...
Curated OER
Explore: 4th Grade Beaufort Wind Speed
Fourth graders measure wind speed, air pressure, humidity, temperature, and wind direction. They compare their observations with those of actual weather forecasts.
Curated OER
Coal Production in the USA
Middle schoolers arrange the states by alphabetical order, find the five top coal producing states and discover their total production levels. They then find all the states which begin with the letter "A" and whose coal production is...
University of Regina (Canada)
University of Regina: Math Central: Map of First Nations Peoples Pre Contact Culture Areas
A color coded map of North America which contains the regions inhabited by different aboriginal nations.
University of Richmond
American Panorama: Mapping Inequality Redlining in New Deal America
Redlining is the act of making it difficult or impossible for people in certain areas to access mortgage financing and thus become homeowners. In between 1935-1940 the Home Owners' Loan Corporation staff members assigned grades to...
Other
Esri: Arc Gis: Agricultural Capability of United States Soils
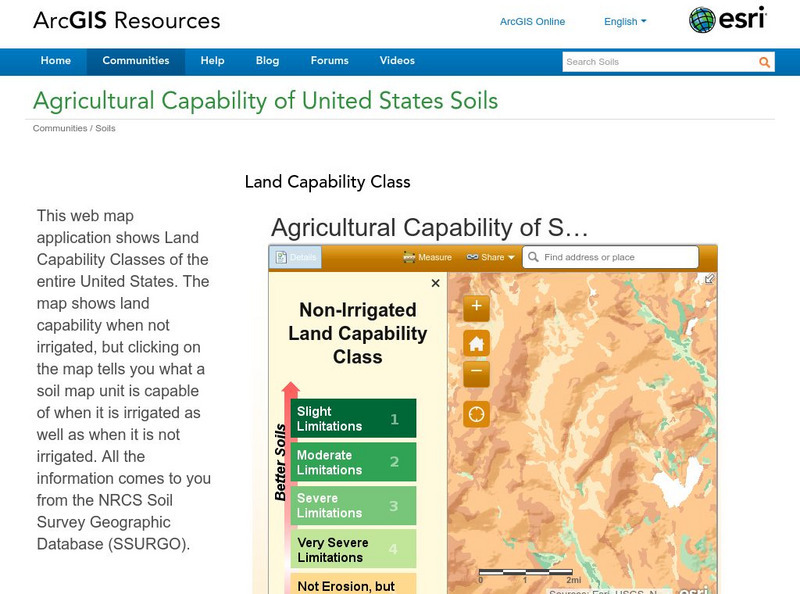
A sophisticated map tool that shows the capability of soils for agriculture, with or without irrigation, for the whole of the United States. Enter a location and a color coded map is shown, along with a key for interpreting it. The...
National Weather Service
National Weather Service: Precipitation Analysis
This interactive map of the US is color coded to show the quantity of rain received throughout the country. Selections can be made to focus on certain areas and certain time frames.
Other
League of Nations: 1920 1946 Map
A color-coded map from Matthew White's Homepage showing which countries were a part of the League of Nations during specific times in history.
TeachEngineering
Teach Engineering: Using Graph Theory to Analyze Drama
Students analyze dramatic works using graph theory. They gather data, record it in Microsoft Excel and use Cytoscape (a free, downloadable application) to generate graphs that visually illustrate the key characters (nodes) and...
TeachEngineering
Teach Engineering: Graphing Your Social Network
Students analyze their social networks using graph theory. They gather data on their own social relationships, either from Facebook interactions or the interactions they have throughout the course of a day, recording it in Microsoft...
US Environmental Protection Agency
Epa: Ecological Regions of North America
A helpful map of North America which color codes its 15 ecological regions. Click on the different regions for a brief description of the area.
HyperHistory Online
Hyper History Online
HyperHistory Online houses a collection of timelines that graphically displays 3,000 years of world history. Uses charts, images, maps, and color-coded text to reinforce the relationships among important persons and significant events in...


