Curated OER
A-Mazing Matter
A fun worksheet with an unusual activity. Here, your students color-code the squares of liquids, solids, and gasses to discover the path in the maze for the robot rat to get to the cheese. Students color twenty-seven squares to draw the...
Curated OER
Color Coding the Periodic Table
In this periodic table worksheet, students color code the periodic table to show groups of elements, the states of elements, if they are man-made or synthetic elements, if they are radioactive and the number of electrons in their outer...
Curated OER
Essential Elements
A color-coded periodic table identifies organic elements, major minerals, and trace elements. Oxidation states are highlighted and types of chemical bonding are annotated. The electron energy level chart is explained. Though not all of...
Curated OER
The Mussels Are Coming
Young scholars work together to identify and describe the various types of mussels. Using a color-coded system, they plot the arrival date of zebra mussels in North American waters. They discuss the increase in their population with the...
Curated OER
Water Conservation
Open learners' eyes to the challenge of finding safe drinking water – something we often take for granted in our country. The PowerPoint presentation includes images, graphs, diagrams, and even a video to stimulate discussion on how we...
Curated OER
Recycling in Palm Beach County
Students investigate the recycling program in Palm Beach County. In this recycling lesson, students discuss how garbage is processed and identify the proper color-coded bins to place recyclables in.
Science Geek
Ionic Compound Formulas
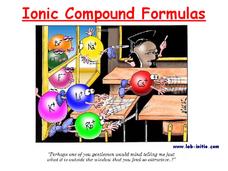
By contrasting cations and anions, this presentation shows how to predict ionic charges by periodic groups. The slides conclude with a few guided practice problems for writing ionic compound formulas.
Artisan Global
QuakeFeed Earthquake Map, Alerts and News
Amateur seismologists explore Earth's earthquakes in real time using a variety of map styles and parameter selections.
Curated OER
Weather Patterns and Acid Rain (or What is Chicago's acid rain doing in the Adirondacks?)
Students examine a color-coded map of U.S. acid rain precipitation intensity. Using EPA data table and the blank U.S. map, they record state-by-state values for magnitude of emissions and compare areas of emissions to areas with the most...
Curated OER
Arbor Day Across the United States
Students perform research about hardiness zones used to guide planting. They read a hardiness zone color-key map and create their own color-key maps to show when different states celebrate Arbor Day.
Curated OER
Exploration Watershed
Learners discuss what a watershed is, and locate watersheds on a map. In this watershed lesson, students use the information they have been introduced to and create a color coded watershed map of their own.
Curated OER
North American Biomes
In this Science worksheet, learners color a biome map of North America. Students color the map by solving the clues listed on a separate sheet of paper.
Curated OER
Oregon Rainshadows
Learners brainstorm list of possible highest locations in Oregon, identify and label places from list on map using color code, and discuss and identify causes of a rain shadow.
Curated OER
San Francisco Bay Watershed
Students examine relief maps of California and discuss the San Francisco Bay watershed. Discussion continues with the class helping complete a journey of water through seasons in a "finish my sentences" style lecture. They label rain...
Curated OER
New Jersey Estuaries
Students experiment to discover that salt water is denser than fresh water by creating color coded solutions. They examine how heavy rainstorms and high tides develop layers of different degrees of density.
Curated OER
Biome Map
In this biomes worksheet, learners color the map of North America according to the biome clues. Students then answer questions about the North American biomes.
Center for Innovation
Air Pollution: What's the Solution?
In this air pollution worksheet, students collect data for their county of residence as well as 10 surrounding counties including the total population and the county grade for the air. They use a map of their state and identify the 10...
Ohio State University
Exploration Activities with Electrostatic Interactions
Step out of the 21st century and discover protons and electrons through observation. Using common materials, participants continually adjust their explanation of charges. The final assessment requires pupils to design their own...
Curated OER
Co-ordination and Response - Lesson Plan
Eleventh graders explain why colour blindness is more common in men than women.
Curated OER
Basic Ideas of Inheritance
Students enter personal information into a database. The information is used to reinforce the ideas of inheritance that is found in 1st Grade Science. Access to technology is essential for this lesson. Adding the use of a mirror for...
Curated OER
Plotting Earthquakes
Students explore earthquakes. Using the National Earthquake Information Center website, students plot daily earthquakes on a map. They observe the magnitude of each earthquake. Students identify the pattern of earthquake locations and...
Curated OER
The Monarch Watch
Young scholars collect and examine the life cycle of monarch butterflies. They also tag butterflies and release them as part of a nation-wide project to study monarch butterfly migration.
Curated OER
Testing Growth of Algae
Students participate in an experiment in which they test the growing rate of algae. They test the algae in different elements recording their observations. They share their results with the class and discuss.
Curated OER
Introduce Solids
Middle schoolers identify and interpret a variety of solid materials - cloth, wood, metal, plastic, paper, and rubber. After a period of free exploration, they then describe the properties of the objects and develop vocabulary in order...


