Curated OER
Two-Column Chart
In this two-column chart activity, students use the blank graphic organizer template as instructed by their teacher. This t-chart may be used for a variety of classroom activities.
Curated OER
Tally Chart/Pictograph
In this graphic organizer worksheet, students can record their own data on this tally chart/pictograph. There are two columns and six rows with room for a title.
Ontrack Media
Chart of Parent Functions
The characteristics of parent function vary from graph to graph. Let learners decipher the graph, table of values, equations, and any characteristics of those function families to use as a guide. The nicely organized page displays the...
Curated OER
Tables
Can you read this table? Learners begin to comprehend data analysis through examining two simple tables and answering comprehension questions. The first gives characteristics about three animals in yes-or-no format (i.e. "eats insects,"...
Houghton Mifflin Harcourt
Graphs from Patterns
Fifth graders analyze patterns and begin looking at function tables. This is a pertinent preparation for graphing patterns. In fact, consider giving your class a piece of graph paper and then teach them how!
Curated OER
Addition Chart (Blank)
In this addition facts worksheet, students fill in the sums on an addition chart with facts from 1 to 10. Students add the numbers in the rows and columns and place answers on the chart.
Curated OER
Addition Chart
In this addition worksheet, students complete an addition chart by writing the sums of the numbers from 1 to 10. The numbers are not in order on the chart; students look at the factors in the rows and columns and add. Some numbers are...
Curated OER
Addition Grid Chart
In this addition worksheet, students fill in the squares in an addition grid. Students add the two numbers in the columns and rows. The addition facts are from 0 to 10.
Curated OER
Odometers and Place Value Chart
Young scholars explore the concept of place value with a hand-made odometer. In this math lesson, students construct a cardboard odometer with movable paper strips to show increases in mileage to the hundredths place. Young scholars...
Curated OER
State Economy Chart
Fifth graders research and record statistics on the economy of an assigned state. They create a spreadsheet in Excel to report the data and a 3D Pie graph using the Chart Wizard in Excel to represent their states' data.
Curated OER
Fraction Spelling
An interesting take on spelling practice is included here! Emerging spellers take their weekly spelling list and create a three-column chart. In the first column, they write the word itself. In the second column, they write how many...
Curated OER
Data Collection and Presentation
Middle and high schoolers collect and analyze data from four different activities. The activities include information about classmates, tallying colors of cars in a parking lot, stem and leaf plots, and making a histogram from winning...
Illustrative Mathematics
Buying Protein Bars and Magazines
Packing for a trip? This activity allows learners to decide how many magazines and protein bars they can buy with twenty dollars. They can organize their work in a chart to track how many items they can purchase. There are two different...
Curated OER
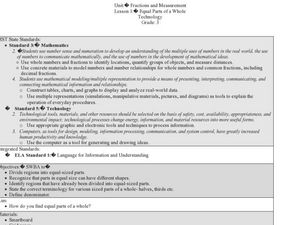
Fractions and Measurement
Using a Smart Board, or a plain ol' white board or chalkboard, the teacher pulls up a grid and demonstrates how squares and rectangles can be divided up into equal parts. The class will get their own graph paper to draw shapes and divide...
Soft Schools
Multiplication Table
Use the multiplication table as an aid for young mathematicians who are learning their multiplication facts. Children can explore the concept of multiplication by using the factors in the far left column and the top row to determine a...
Curated OER
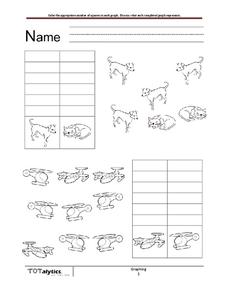
How Many?
How many cats are there? Dogs? As learners examine a set of images, they fill in a chart to indicate how many of each image there are. In the first series, there are four dogs and two cats. In the second, there are three planes and six...
Curated OER
How Many Fish in the Pond?
How many fish are in Mills Pond? Learners examine an image with 17 fish. There are four types of fish, each of which is displayed on a data chart. Focus on collecting data and counting as scholars record the number of each type in its...
Ed Migliore
Linear Equations in Two Variables
This traditional textbook style unit includes vocabulary, a direct explanation section, examples, practice problems that directly line up with the explanations and examples, and a unit summary review and practice problems. Learners get...
EngageNY
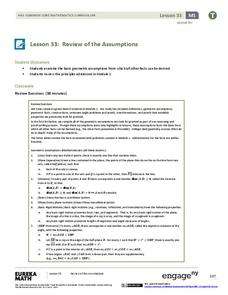
Review of the Assumptions (part 1)
What was the property again? Tired of hearing this from your pupils? Use this table to organize properties studied and as a reference tool for individuals. Learners apply each property in the third column of the table to ensure their...
Curated OER
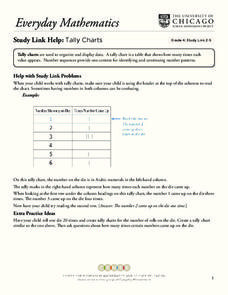
Tally Charts
In this tally charts worksheet, learners discuss how to use a tally chart and how to read the chart. Once students record information on a tally chart they answer questions showing their ability to read a tally chart.
Curated OER
Fill It Up
In this filling in a chart worksheet, 3rd graders write a specific number in 15 boxes that fits the rule for each column and row. Students can use any number only once.
Curated OER
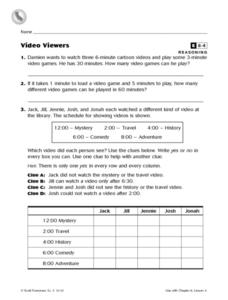
Video Viewers
In this video viewers worksheet, 3rd graders solve 2 word problems dealing with watching videos, read and analyze 4 clues in order to fill in a chart correctly involving 5 people and the types of videos they watch.
Curated OER
KWL Chart
In this graphic organizer worksheet, students will use a chart to organize their information into 3 columns: what I know, want to learn, and what I learned.
Curated OER
Multiplication Charts, Multiply By 2-10
In this multiplication chart activity, students will solve multiplication problems where they complete a two column chart. On each chart one of the factors is two through 10. The other factor may be any number because it is left blank.


