Curated OER
Collecting And Organizing Data
In this collecting and organizing data worksheet, learners, with a partner, problem solve and calculate the answers to six mathematical word problems.
Curated OER
Tables and Data
In this tables and data learning exercise, students use a given data table to answer a set of 8 questions. A website reference for additional activities is given.
Curated OER
Data and Tables
In this data and tables worksheet, students use a given data table to answer a set of 8 questions. A website reference is given for additional resources.
Curated OER
Market Failures
Market failure and the effects it has in terms of social benefit is the focus of this eight-page packet. Perfect for homework, this set of excellent worksheets provides several scenarios and graphs that show positive and negative...
Mr. T Davis
Major Works Data Sheet
Ease the anxiety of preparing for the AP English exams with a four-page packet test-takers can use to record key information about major works they have read. In addition to biographical information about the author, historical...
EngageNY
Describing Center, Variability, and Shape of a Data Distribution from a Graphical Representation
What is the typical length of a yellow perch? Pupils analyze a histogram of lengths for a sample of yellow perch from the Great Lakes. They determine which measures of center and variability are best to use based upon the shape of the...
Beyond Benign
Can You Hear Me Now? Cell Phone Accounts
How sustainable are cell phones? Throughout the unit, learners explore the issues around cell phones concerning sustainability. Class members take a graphical look at the number of cell phones across the world using a box-and-whisker...
CK-12 Foundation
Understand and Create Histograms: Car Sales
Create a history of car sales. Pupils create a histogram/bar graph to show the number of car sales made during the week. Using the data display, learners calculate numerical summaries of the data and find the percent of cars sold during...
EngageNY
Describing the Center of a Distribution Using the Mean
Everyone does their fair share. The sixth segment in a 22-part unit presents the mean as a fair share. Groups build a conceptual understanding of the mean of a data set, rather than simply learn an algorithm. Learners use the...
Shodor Education Foundation
Multiple Linear Regression
You'll have no regrets when you use the perfect lesson to teach regression! An interactive resource has individuals manipulate the slope and y-intercept of a line to match a set of data. Learners practice data sets with both positive and...
CK-12 Foundation
Two-Sided Stem-and-Lead Plots: Gamers
Which gender spends more time playing video games? Your classes use provided data to answer this question. They first build a two-sided stem-and-leaf plot and then use the display to look for patterns. Guiding questions help them...
Howard Hughes Medical Institute
Spreadsheet Tutorial 4: t-Test
The t-test tutorial will fit your needs to a T. After calculating the mean, sum of squares, standard deviation, and variance of two data sets on a spreadsheet, scholars learn to calculate the t-values. They then learn to use the TTEST...
International Technology Education Association
Pixel This!
Did the image I drew match the image you saw? By simulating a satellite and a ground station, teams of two transmit data in the form of pixels in order to recreate an image. They use four different levels of brightness, creating slightly...
Curated OER
Scatterplots
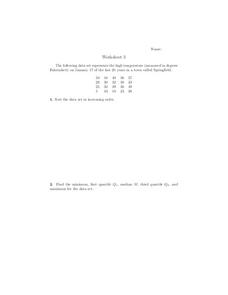
In this scatterplots worksheet, 9th graders solve and complete 6 different word problems with different sets of data. First, they sort the data set in increasing order and find the minimum, first quartile, median, third quartile, and...
Curated OER
Reading Frequency Tables
In this data interpretation activity, students record the data from 10 examples into frequency tables. They group 10 more data sets, and make a frequency table for each.
Curated OER
Data Analysis: Investing is an "Interesting" Experience
Students compute interest earned. In this data analysis lesson plan, students examine investments and interest rates. They compute the total interest earned and find the simple interest.
Curated OER
Maps and Modes, Finding a Mean Home on the Range
Fifth graders investigate data from maps to solve problems. In this data lesson, 5th graders study maps and collect data from each map. Students present their data in a variety of ways and calculate the mode, mean, median, and range.
Curated OER
Mean, Median, Mode, and Range - Homework 14.3
In this data and statistics learning exercise, students find the mean, median, mode, and range of 4 different sets of data. Next, students solve 1 word problem where they find the mean.
Curated OER
What's Your Average? What Do You Mean? I'm More Than Just Average
Upper grade and middle schoolers collect data, analyze and interpret the data. This three-part lesson should provide learners with a firm understanding about the differences between mean, median, and mode and how to perform the...
Curated OER
Scatter Plot Basketball
Learners take turns shooting baskets and creating scatterplots based on the data. They create two graphs and look for possible correlation in the data for each graph.
Curated OER
Statistics and Shopping
Explore how statistics are used in everyday life. Your soon-to-be savvy consumers use the Internet to find consumer-related statistical information and learn to make wise consumer decisions. Includes links to a practice sheet about data...
Curated OER
Why Are The Shore Birds Dying?
Students engage in a field study of birds and how they are in danger harm due to environmental factors. They list different possible causes in a prediction activity. The observations are done while writing up data and connecting it to a...
Curated OER
How to Draw a Bar Chart Correctly
Your class has gathered their data, so what's the next step? They need to display and analyze their data, and a bar chart is a perfect tool for the job. This resource provides the step-by-step instructions those kids need to construct a...
Curated OER
Digital Statistics
Research data analysis by creating charts in class. Define the differences between an "average" and "range" while examining measurement data based on student height. Utilize computer software to create a height graph which is shared with...
Other popular searches
- Comparing Two Data Sets
- Comparing Sets of Data
- Comparing Related Data Sets
- Comparing Two Sets of Data


