EngageNY
Connecting Graphical Representations and Numerical Summaries
Which graph belongs to which summary statistics? Class members build upon their knowledge of data displays and numerical summaries to connect the two. Pupils make connections between different graphical displays of the same data in...
Statistics Education Web
The Case of the Careless Zookeeper
Herbivores and carnivores just don't get along. Using a box of animal crackers, classes collect data about the injury status of herbivores and carnivores in the box. They complete the process of chi-square testing on the data from...
Curated OER
Exploring Quadratic Data : Transformation Graphing
High schoolers analyze the vertex form of a parabola and find an approximate fit of a model. They explain the quadratic parabola function and its properties by developing quadratic models. They use translation and dilation to change the...
Florida Department of Health
Exploring Healthy Relationships Unit
A four-lesson unit on healthy relationships begins by helping individuals develop a positive sense of self-worth by identifying their own positive characteristics. Participants also examine data from the YRBS Online Tool about the...
Space Awareness
Valleys Deep and Mountains High
Sometimes the best view is from the farthest distance. Satellite imaging makes it possible to create altitude maps from far above the earth. A three-part activity has your young scientists play the role of the satellite and then use...
Beyond Benign
The Big Melt: Arctic Ice Caps
Are the Arctic ice caps really melting out of existence? Junior climatologists examine the statistics of ice decline through four math-based lessons. Each activity incorporates data, climate information, and environmental impact into an...
Bowland
Mystery Tours – Plan Your Tour
Everyone loves a vacation and a set of three activities has groups planning a tour of the U.K. using given distance, time, and price data. They solve a variety of problems related to the trip and produce a report on the success of...
EngageNY
Margin of Error When Estimating a Population Proportion (part 2)
Error does not mean something went wrong! Learners complete a problem from beginning to end using concepts developed throughout the last five lessons. They begin with a set of data, determine a population proportion, analyze their result...
BioEd Online
Butterflies in Space
How does gravity affect the life cycle of a butterfly? Learn first-hand what types of investigations astronauts perform in space by following along with one of NASA's experiments. Create butterfly habitats in the classroom with specific...
Radford University
Body Measurement Activity
Don't keep the resource at an arm's length. A hands-on activity has scholars measure the heights, arm spans, hair lengths, and foot lengths of their classmates. They create scatter plots to determine if there is a correlation between...
NASA
Build a Light Detector Inspired by Space Communications
Data can travel on light waves ... who knew!?! Pupils explore the idea of using light waves to transmit data through space. They then build their own boards that detect a specific wavelength of light.
Curated OER
How Fast is it Traveling?
Middle schoolers calculate the rate of speed of various moving objects within the classroom setting, or outside under a controlled environment.
CCSS Math Activities
Smarter Balanced Sample Items: 6th Grade Math – Target J
What is the best measure of central tendency? Scholars explore mean, median, mode, range, and interquartile range to understand the similarities and differences. They display data in dot plots, histograms, box plots, and more as part of...
Curated OER
Probability: What's Most Likely?
Work with graphs, tally marks, and probability. Fifth graders read tables with different sets of data, including tally marks and a bar graph, to answer five questions. Use this instructional activity as part of a probability lesson, or...
Curated OER
Data Analysis and Probability
Students make their own puzzle grid that illustrates the number of sit-ups students in a gym class did in one minute, then they make a histogram for this same data. Then they title their graph and label the scales and axes and graph the...
Curated OER
Interpreting Data and Statistics
Young scholars define terms and analyze data. In this statistics lesson, students plot their data using bar and line graphs. They analyze their data after they graph it and apply the results to the Great Depression.
Curated OER
Data Corruption by High-Energy Particles
In this data corruption by high-energy particles, students solve 4 problems about the solar flare that corrupted the imagers measuring them. Students find the speed of the arriving particles and the percentage of light-speed the...
Alabama Learning Exchange
The Mean, Median, and Mode Chain Gang
Students analyze a set of data. They work in cooperative groups and use chain links to identify the mean, median, and mode of the chain.
Curated OER
Sets an the Venn Diagram
Students explore the characteristics of sets and Venn Diagrams. Given data, students practice determining the placement of elements in a Venn Diagram. Students discuss the correspondence between data sets and their graphical...
Curated OER
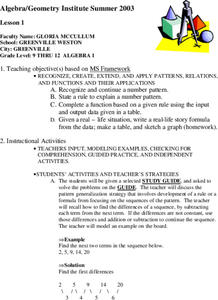
Patterns, Relations, and Functions
Young scholars investigate the patterns of different data sets of numbers. They use critical thinking skills in order to find the missing numbers in any given set. This lesson helps to develop the skill of number sense.
Curated OER
Mean Absolute Deviation in Dot Plots
The lesson plan focuses on the ideas of dot plot representations and the mean absolute deviation of data sets.
Alabama Learning Exchange
I Know What You Did Last Summer: A Data Graphing Project
Young scholars participate in graphing data. In this graphing data instructional activity, students make a stem and leaf plot of their summer activities. Young scholars create numerous graphs on poster boards. Students...
Curated OER
Reflection on Educational Goal Setting and Self-Assessment
Third graders evaluate their performance at school. They examine their most recent spelling test scores to determine whether or not they met their goals for the test.
Curated OER
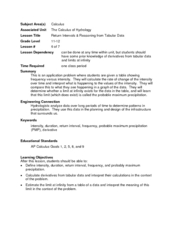
Return Intervals & Reasoning from Tabular Data
Young scholars calculate derivatives from a set of data. In this calculus lesson, students estimate the limit at infinity. They complete a Return Interval handout at the end of the lesson.
Other popular searches
- Comparing Two Data Sets
- Comparing Sets of Data
- Comparing Related Data Sets
- Comparing Two Sets of Data


