Curated OER
The Human Line Plot
Fifth graders collect data and use charts and line plots to graph data. Through class surveys, 5th graders collect data concerning a particular subject. They graph their data using a line graph. Students make inferences and predictions...
Curated OER
Getting A Grip On Graphs
Fourth graders investigate the concept of graphing and comparing different types of data using pictographs, line graphs, scatter plots, etc... They gather data and make interpretations while examining the medium of how it is displayed.
Curated OER
The Great Race
Students identify the mean, median and mode of collected data. For this statistics lesson, students collect, graph and analyze data using central tendencies. They work in groups to collect data on a robot through an obstacle course.
Curated OER
My Peanut Butter is Better Than Yours!
Students explore the concept of statistical data. In this statistical data lesson, students read an article about the dangers of peanut butter to those who are allergic. Students perform a taste test of two different brands of peanut...
Curated OER
Seized Before Flights: Graph
In this bar graph worksheet, learners analyze a graph that show the number of prohibited items intercepted at U.S. airport screening checkpoints. Students answer 3 problem solving questions about the data on the graph.
Curated OER
Information at a Glance - Using Tables in Mathematics
Students create table to display GED Testing data located in paragraph provided by teacher, use information in table to create appropriate graph, and determine percentage difference between passing scores and failing scores.
Curated OER
Discovering Pi
Students develop a formula that describes the functional relationship of the circumference of a circle to its diameter. Working with a partner, they measure the diameter and circumference of circular objects in order to discover the...
Curated OER
Temperature Bar Graph
Students explore mean, median and mode. In this math lesson, students analyze temperature data and figure the mean, median, and mode of the data. Students graph the data in a bar graph.
Curated OER
Climate Systems - Which Location Is Best For Me?
Students study the difference between weather and climate. In this climate systems lesson students search the Internet for the parts of the Earth's system, gather climate data and complete a challenge scenario.
Curated OER
The Fat and the Lean
Students collect data on calorie intake. In this algebra activity, students use the collection of data to make better eating decisions. They investigate the nutritional value in food using a graph and draw conclusion from their findings.
Curated OER
Creating Line Graphs
Pupils draw line graphs. In this math lesson, students interpret minimum wage data and graph the data in a line graph. Pupils predict the next minimum wage and figure the earnings for a 40 hour work week for someone earning the minimum...
Curated OER
Being an Educated Consumer of Statistics
Students examine kinds of data used to report statistics, and create their own statistical report based on any of the four sources of media information (Internet, newspaper, TV, magazine).
Curated OER
Memory Game
Students create cards for a memory game by entering data into a spreadsheet that is then merged into a word processing document. Tutorials are available through links on the activity page.
Curated OER
Local Traffic Survey
Students conduct a traffic survey and interpret their data and use graphs and charts to display their results.
Curated OER
Give Me a Minute
Students categorize data. In this categories instructional activity, students get a specific topic and they have a minute to list as many items that fit under this topic. They compare lists with a classmate and discuss whether all...
Curated OER
Significant Science: Statistics for Planet Earth
Ninth graders discover how statistics are used to interpret results of scientific experiments. Students write hypotheses and test the hypotheses by collecting data and organizing the data. Students graph their data to produce a visual....
Curated OER
Probability
Third graders conduct experiment, collect data, predict, record, and discuss outcomes, and analyze data for probability.
Curated OER
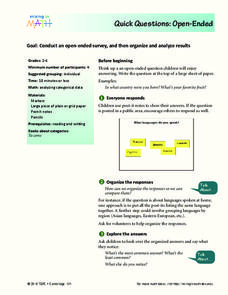
Quick Questions: Open-Ended
Students conduct an open ended survey and analyze the data they found. For this open-ended survey lesson plan, students ask others their open ended questions and then organize their results based on the most common, least common, and...
Curated OER
Astro-Madness
Students study the different telescopes and instruments used in the Observatory. In this engineering and research lesson students explore telescopes using a website and build data tables about them.
Curated OER
Building Sets of 13 and 14
Compose and decompose sets of 13 and 14 and compare sets of each with your little learners. They use objects to construct sets of 13 and 14, record their answers, and compare sets in several different ways.
Curated OER
Graphs: All About Our Class
Students respond to survey questions, discuss results, brainstorm ways to represent survey information, and create table of class results. They find mean, range, and percentages, and create graph to display results.
Curated OER
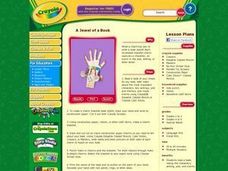
A Jewel of a Book
Students read a book, noting the characters, setting, plot, and events. They gather, synthesize, and then select the most important data from their book to prepare a book report by decorating a charm bracelet with pertinent information...
Curated OER
Goal-Makers Win the Game!
Fifth graders are introduced to the meaning of the word "goal". As a class, they identify examples of goals with their teacher's guidance. Individually, they complete a worksheet to identify their short and long term goals and complete a...
Other popular searches
- Comparing Two Data Sets
- Comparing Sets of Data
- Comparing Related Data Sets
- Comparing Two Sets of Data


