Curated OER
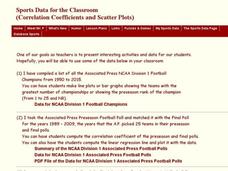
Sports Data for the Classroom
In this algebra worksheet,students rewrite word problems using algebraic expressions. They collect data and plot their findings on the graph and analyze it. There is an answer key for this worksheet.
Curated OER
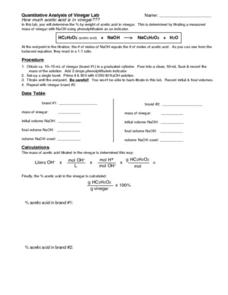
Quantitative Analysis of Vinegar Lab
For this quantitative analysis worksheet, students perform a lab to determine the amount of acetic acid in vinegar by doing a titration. They use an indicator phenolphthalein to determine the endpoint of the titration.
Curated OER
Excel for Beginners
In this Excel lesson, students set a formula to check their homework. Students also use clipart, work in groups, and learn to use the tools in the drop-down list.
PBIS World
Tier 1 Intervention General Tracking Form
Looking for a way to compile data based on behavior interventions? This spreadsheet can help you out! You type in up to five behaviors and five interventions and tally whenever a behavior or intervention is used. The spreadsheet...
Lane Community College
Review Sheets: Beginning Algebra
This jumbo worksheet contains everything you need to get through Pre-Algebra. Begin with simple expressions, and end with linear functions and polygons. There are multiple problems for each topic to make sure those skills are set.
Curated OER
Snow Cover By Latitude
Students create graphs comparing the amount of snow cover along selected latitudes using data sets from a NASA website. They create a spreadsheet and a bar graph on the computer, and analyze the data.
Curated OER
Collecting And Fitting Quadratic Data
Pupils investigate the concept of using quadratic data to plot coordinates on a plane. They also apply the quadratic formula for a variety of problems with the help of a graphing calculator to draw the parabola for given coordinates.
Curated OER
Model Data with Quadratic Functions
Students model data using quadratic equations. In this algebra lesson, students simplify and factor quadratic equations. They graph the function using collected data and analyze the parabola.
Curated OER
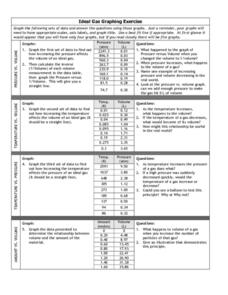
Graphing Exercise of Ideal Gas Data
For this graphing of Ideal Gas Data worksheet, students use the given data to draw 4 graphs of the given data. They are given the pressure and volume to draw and interpret the graphs.
Curated OER
Statistical Analysis of Data by Gender
Students examine and identify gender bias, stereotyping, and discrimination in school materials, activities, and classroom instruction. They apply descriptive statistics knowledge to real-world data.
Curated OER
A Data Processing Lesson for Statistics -- Reading a Table or Chart
Learners identify the structure and key parts of tables and charts. They determine which data is meanjngful and make comparisons with the data. They describe the scope of the AIDS plague throughout the world.
Curated OER
Organizing Data Using Tables and Graphs
Learners create graphs and tables, as well as interpret and make inferences from the data shown to determine when and where graphs and tables are most useful.
Curated OER
Locating Vent Fields Using CTD Data
Students describe the way hydrothermal vents work. Students work on locating vent regions through remote collection of data about water temperature and density. Comparing density and temperatures graphs, students search for indicators...
Curated OER
Mean, Mode, Median
In this mean, mode, and median learning exercise, 8th graders solve and complete 6 different problems that include determining the mean, mode and median of various sets of numbers. First, they explain how to determine the median, mode...
Curated OER
Application and Modeling of Standard Deviation
The first activity in this resource has learners computing the mean and standard deviation of two different data sets and drawing conclusions based on their results. The second activity has them using a dice-rolling simulation to...
Curated OER
How Alike Are We?
Fourth graders find the range, mode, median, and mean for each of the data sets (height and shoe size). They discuss which measure of central tendency for each data set best represents the class and why. Students graph the shoe size and...
Curated OER
Sink or Float
Third graders sort objects into those they think will float and those that will sink and test their predictions. They experiment with clay molding it into shapes that float. They place pennies in them until they sink. They test other...
Curated OER
Using Averages
In this math worksheet, students compute the range, mean, median and modal weight of candy bars from two machines. Students write a short essay about which machine is using too much chocolate and which is more reliable.
Curated OER
Add and Subtract with Hudson River shipping
Rivers aren't just a place for animals to live, they also provide industrial transportation. The class will examine the Hudson River on a map, discuss all the commercial vessels that use the River to transport materials, then complete a...
Curated OER
Mean, Median, and Mode
Fourth graders compare two sets of data by using a double bar graph. In this data analysis lesson plan, 4th graders study a double bar graph and complete questions based upon the data. Students construct a table to show the data from the...
Curated OER
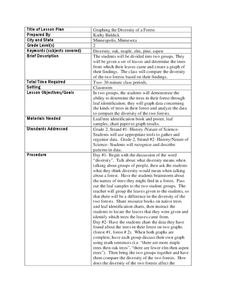
Graphing the Diversity of a Forest
Second graders work in groups to identify what types of trees create which types of leaves In this plant life lesson plan, 2nd graders analyze a set of leaves and identify the tree it came from while graphing the data in a science...
Curated OER
Histograms and Bar Graphs
Young scholars examine the use of bar graphs and histograms. For this data representation lesson, students investigate the proper use of bar graphs and histograms to represent data. They learn the proper geometric definitions, experience...
Curated OER
Asthma Survey
Students collect survey data on the prevalence of asthma in a community. They summarize and display the survey data in ways that show meaning.
Curated OER
Cartesian Coordinates
Students investigate rational numbers through data analysis and statistics. For this algebra lesson, students represent, rename, compare and order rational numbers. They collect and represent data correctly on a graph.
Other popular searches
- Comparing Two Data Sets
- Comparing Sets of Data
- Comparing Related Data Sets
- Comparing Two Sets of Data


