Curated OER
Violence On TV
Students examine violence on TV. In this data collection instructional activity, students explore TV violence. Students watch TV shows and fill out a checklist about the amount of violence. Students organize and analyze the...
Curated OER
Money Management Intelligence
Students follow directions to help a client with his/her budget. After selecting their client, they download confidential data and listen to the challenge presented on the website. They adjust the budgets as needed. Then, they click play...
Curated OER
Changing Planet: Permafrost Gas Leak
Pair earth scientists up to use an amazing online arctic portal mapping tool and Google Earth to analyze permafrost changes. They compare changes to data on atmospheric concentrations of methane to see if there is a correlation. Then...
Curated OER
Mystery Liquids: Linear Function
High schoolers determine the linear equations of the density of water and oil by collecting data on the mass of various volumes of each liquid. They construct scatter plots from the data and use these to write the linear equations for...
Curated OER
Fossil Fuels (Part II), The Geology of Oil
More of a mini-unit than a lesson, these activities lead inquisitors through a survey of oil deposits. In the first part, they read about and view diagrams of sedimentary rock layers that trap oil. Next, they test porosity and...
Curated OER
Chromatographic Separation of Methylene Blue and Sodium Fluorescein
Students determine the best solvent system for separating a methylene blue/sodium fluorescein mixture by thin layer chromatography. They conduct an initial TLC separation using ethanol and a different solvent mixture and analyze the data...
Curated OER
Fossil Fuels (Part III), The Geology of Coal
Do not overlook this set of lessons just because your school does not have a data analysis system. There is plenty of material here to administer a complete mini unit on the formation, distribution, and properties of coal. Since it...
National Security Agency
It's Probably Probable
Learners make predictions and draw conclusions from given information as they learn the meaning of probability in this vocabulary-rich, integrated activity that presents a variety of teaching strategies to motivate and reach...
Curated OER
Out of this World: Inquiry-Based Teaching
Connect classroom learning with real-life experiences by using photographs and data taken by the Mars Pathfinder.
Channel Islands Film
Island Rotation: Lesson Plan 3
How far have California's Channel islands moved? What was the rate of this movement? Class members first examine data that shows the age of the Hawaiian island chain and the average speed of the Pacific Plate. They then watch West...
Curated OER
Photosynthesis
Students recognize the importance of plants as they perform an experiment involving photosynthesis. Students determine the optimum wavelength of light for photosynthesis by exposing plants to different colors of light, collecting data,...
Curated OER
Exploring Countries and Cultures
Fifth graders choose a country associated with a family member and research its location, government, language, economy, history, holidays, foods, sports, and famous people. They write to inform using this data and draw a map identifying...
Virginia Department of Education
Properties of Compounds and Chemical Formulas
Young chemists have unknown compounds they need to sort. Performing three different tests on each, the chemical behaviors they observe become the basis for data analysis.
Howard Hughes Medical Institute
Gorongosa: Making Observations Activity
Do you have young scientists wanting to make new discoveries rather than just completing the same experiments? Young scientists use their observational skills to identify animals and patterns in animal behavior. Through tracking...
University of California
Student Workbook: Statistics and Probability
Statistically, practicing this packet completely helps young mathematicians do well on the test. The packet is adaptable to many grade levels as it includes basic probability and goes up to data analysis with mean, median, and...
Curated OER
Quadratic Equations with the CBL 2
Learners practice generating parabolas with a motion sensor while determining the vertex form of the equation. They compare it to the regression equation from the calculator onto a data mate software. Each student completes several...
Centers for Disease Control and Prevention
Solve the Outbreak
Pretend to be an Epidemic Intelligence Service officer for the Centers for Disease Control and Prevention. Detectives deal with data and make decisions to determine the dawn of the disease!
Howard Hughes Medical Institute
Survival of the Fittest - Variations in the Clam Species Clamys sweetus
It's not often that you come across a clever laboratory activity that is both imaginative and comprehensive! Using M&M's and Reese's peanut butter candies to represent two different clam species, young biologists test for "relative...
Curated OER
Plastic Packaging
Students collect data. In this math lesson, students collect data about recyclable materials. Students develop a plan that will help the environment. Recycling plastic containers is discussed.
Curated OER
Grade 5: Alphabet Frequency
Fifth graders collect and organize data from writing samples, use fractions and decimals to describe the experimental data, and use the experimental results to make predictions about the frequency of letter usage in the English language.
Curated OER
How do We Treat Our Environment?
Seventh graders explore the concept of collecting data. In this data collection lesson, 7th graders survey others about their environmental habits. Students graph their data.
Curated OER
Favorite Candy Bar Graph
Students decide on six different types of candy bars to include in a data collection activity. Working in small groups, they survey a target group in a set amount of time. They access a Internet based graphing tool to create a bar graph...
Curated OER
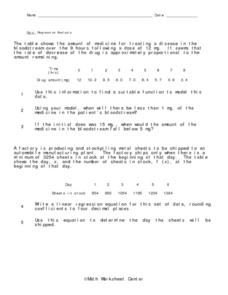
Regression Analysis
In this regression analysis instructional activity, 9th graders solve 10 different word problems related to regression analysis. First, they use the information given to find a suitable function to model the data. Then, students use the...
Curated OER
Get the Picture with Graphs
Fifth graders examine line, bar and circle graphs in the newspaper and on the Internet. They complete sketches of graphs with an emphasis on selecting the best model to depict the data collected.
Other popular searches
- Comparing Two Data Sets
- Comparing Sets of Data
- Comparing Related Data Sets
- Comparing Two Sets of Data


