Curated OER
Dog Days or Dog Years?
In need of some algebraic fun with real world implications?Learners use ordered pairs, a table of values and a scatter plot to evaluate the validity of several real world data sets. The class focuses on dog ages in human...
Curated OER
Build A Skittles Graph
Students explore graphing. In this graphing activity, students sort Skittles candies and use the color groups to create a bar graph. Rubrics and extension activities are provided.
Curated OER
Time Management
Students plot activities for a 24 hour day. They record their information on a spread sheet program. Students list categories they use and write equations for cells that add cells of each category together. Students create a pie chart of...
Curated OER
Climographs
Learners identify trends and characteristics of climate zones and specific places within. Then, they graph annual climate trends (primarily Temperature and Precipitation) and create, interpret and extrapolate information based on...
Curated OER
Graph It with Coffee!
Students interview employers and employees at local coffee shops about sales and profits and create graphs comparing and contrasting information obtained about the businesses.
Curated OER
Contour Basics: JAVA Mac/PC
Students explore how to draw contour lines from limited data and extend this knowledge to real data sets. They participate in many opportunities from students to assess their own progress and the exercise is completely online.
Curated OER
Greatest Common Factor
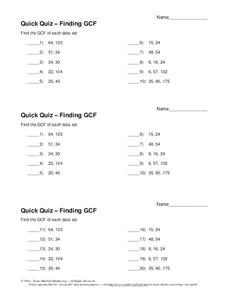
For this finding the greatest common factor quiz worksheet, students observe two numerals in each data set and solve. Students solve 10 problems.
Curated OER
Sense of Taste
Learners swab different sections of the tongue to identify taste buds. In this sense of taste lesson, students make predictions and conduct an experiment. Learners experiment with a variety of flavors and discuss results of the...
Curated OER
Rules of the Roll
Students roll a ball down a plank and measure the distance it travels. Students graph the distances the ball travels as they change the height of the incline (increase slope).
Curated OER
Creating Circles
Students make a circle graph. In this graphing lesson plan, the teacher conducts a class survey, then demonstrates how to make a pie graph. When students are comfortable with the material, they use a worksheet to create their own graph.
Curated OER
The Great MPA Debate
Students study the 'Marine Protected Areas' process. In this ocean lesson students work in groups, conduct research and present it to the class.
Curated OER
Carbon Monoxide and Population Density
Tenth graders investigate the carbon monoxide level at a fixed latitude to determine if there is a relationship to population density. They download data sets and generate a graph, and find locations using the Earth's coordinate system....
Curated OER
Place Value
Second graders complete math problems. In this place value instructional activity, 2nd graders read the book "One Grain of Rice" and use it to learn about place value. Students use index cards and rice to complete a place value activity.
Curated OER
Our Desert Backyard
Students make observations of their own backyard. In this environment activity, students keep records of the plants and animals they see in their home or school yard. Students make notes of how the weather and environment changes over...
Curated OER
Beans and Birds: A Natural Selection Simulation
Students solve the following problem concerning the evolution of seed color in pinto bean plants: "How does natural selection change the frequency of genes or traits over many generations?" They use the constructivist approach to...
Curated OER
A Wet Welcome Home
Students investigate data collection and analysis. In this Algebra I lesson plan, students create a scatter plot and find the equation of best fit in a simulation of a leaking water pipe.
Curated OER
Statistics
In this statistics activity, students solve and complete 6 different problems that include determining various types of statistics. First, they determine the data set where the median value is equal to the mean value. Then, students use...
Curated OER
Cyber Chow Combos
Students, after watching the CYBERCHASE episode, "A Day at the Spa,"represent and count combinations of choices using tree diagrams.
Curated OER
Enthalpy Worksheet
In this chemistry worksheet students complete chemical equations by calculating what the ending formula will be and balance equations.
Curated OER
Extraordinary Extrapolation
Learners study how scientists have estimated the maximum height to which trees can grow, and assess the reliability of interpolation and extrapolation techniques by making predictions with particular data sets and analyzing accuracy of...
Curated OER
The Too Small House: Story and Craft Activity
Engage students in setting and character with this story and craft activity set. To begin the activity, learners read the short story "The Too Small House." They then cut out and color a picture of the house and paper figures of the...
Curated OER
Students Favorites
Students complete activities using a frequency table and construct a pie graph for the data. In this frequency table lesson, students complete a survey to find data for a frequency table. Students use the given link to make a pie graph...
Curated OER
Blast the Fats
Students examine the fats found in foods. In this nutrition lesson, students identify the types and amounts of fats found in foods as they research food labels and the Internet. Students classify the fats and record their data.
Curated OER
How Caves Are Formed
Students explore caves. For this cave formation lesson, students take a virtual tour of a cave and then participate in a scientific investigation that requires them to grow crystals and chart data regarding their growth.
Other popular searches
- Comparing Two Data Sets
- Comparing Sets of Data
- Comparing Related Data Sets
- Comparing Two Sets of Data


