Curated OER
Logistic Growth Model, Explicit Version
Via the concrete setting of estimating the population of the US, your algebra learners are introduced to a logistic growth model. Comparing and contrasting logistic, exponential, linear and quadratic models, to see which fits the data...
Curated OER
Galaxy Hunter - A Cosmic Photo Safari
Space science stars journey through our night sky and take virtual photos of galaxies to investigate simple random samples. Higher math is used to analyze the data collected. Copy the evaluation/assessment questions onto a handout...
Curated OER
Graphing the Forecast - Line Graph or Bar Graph?
Sixth graders compare and contrast bar and line graphs. Using a weather forecast of the area, 6th graders record the high and low temperatures in a table. Students determine and justify the most appropriate graph to display a given set...
Kenan Fellows
Density
Most scholars associate density with floating, but how do scientists determine the exact density of an unknown liquid? The third lesson in a seven-part series challenges scholars to find the mass and volume of two unknown liquids. Each...
Curated OER
How Are Stars Like People?
A beautifully written lesson plan delves into a beautiful topic: stellar population. Engage aspiring astronomers with activities that examine human populations and then transition onto the stars of the universe. Data and photographs for...
Curated OER
Historical Pollution in the Hudson: Part 2
Ninth graders practice how to format and enter data into an Excel spreadsheet, make a graph, and interpret graphed data. They recognize how the pollution in the Hudson River has changed over time, and explain the consequences of these...
Curated OER
How Many Letters Are In Your Name?
Students discover how to make a graph that represents the number of letters in their names. In this early childhood math lesson plan, students collect data, categorize data, and develop skills to analyze the pieces of data.
Curated OER
Decimals Decide Olympic Champions
The class discovers how a decimal can make all the difference in the Olympics. As they learn about decimal place values, they compare and contrast data and demonstrate decimal values using manipulatives.
It's About Time
Taking a Ride on a Lithospheric Plate
Assist your pupils and broaden their horizons with several activities that determine the exact positioning of various communities over the globe. Pupils use data from the Global Positioning System to determine the position and rate of...
Rochester Institue of Technology
Ergonomic Design
To an engineer, the glass is never half full; it's just double the necessary size. The fifth installment of a nine-part technology and engineering series teaches pupils about the idea of ergonomic design. Measurements of popliteal height...
PBL Pathways
Do Homework?
To complete homework or not to complete homework ... that is the question. Decide whether it makes a difference on finals by doing homework. Individuals create a scatter plot and find a line of best fit for data on the percent of...
Virginia Department of Education
z-Scores
Just how far away from the mean is the data point? Pupils calculate the standard deviation for a set of data and find out how many standard deviations a point is away from the mean. The teacher leads a discussion on how to calculate...
Curated OER
Drug and Alcohol Awareness
Fourth graders examine the statistics when it comes to teens and drug and alcohol abuse. In groups, they research the side effects of four different drugs. Using the information, they perform a skit, or puppet show to share their data...
Illustrative Mathematics
Puzzle Times
Give your mathematicians this set of data and have them create a dot plot, then find mean and median. They are asked to question the values of the mean and median and decide why they are not equal. Have learners write their answers or...
Kenan Fellows
Half-Life
Scholars shake their way to understanding half-life with the help of candy. They observe and record which side candy lands on to graph the exponential decay in the fifth lesson of seven integrating chemistry and algebra. Combining...
Purdue University
The Represented World: Recreational STEM
How are forces and motion important to a swing set? Scholars explore the concepts of force and motion using swing sets. In preparation for their own STEM design project, individuals take surveys and data from peers, complete labs on...
Curated OER
# 21 Measuring Nitrate by Cadmium Reduction
Students design an experiment to evaluate the effects of various treatments on the nitrogen cycle in a freshwater aquarium. They are required to maintain a laboratory notebook of all work, measure the key analytes of the biosystem at...
Curated OER
Chemical Resistance and Synthetic Polymers
Students participate in lab activities in which they examine immersion, stain resistance, and stress cracking of synthetic polymers. Students use their collected data to discuss service applications and possible performance of materials.
Curated OER
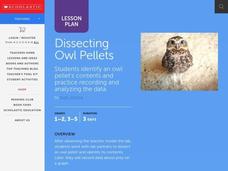
Dissecting Owl Pellets
Young scholars watch the teacher model the dissection then in pairs, they dissect an owl pellet and identify its contents. They record the data about its prey on a graph.
Houghton Mifflin Harcourt
Unit 5 Math Vocabulary Cards (Grade 4)
A set of 49 cards can enhance fourth graders' math vocabulary. It provides a pair of cards on each sheet, one with the word printed in bold text, and the other with the definition of the word. Topics of the cards include mostly...
NASA
Connecting Models and Critical Questions
Scholars use data to analyze and determine which sets of information need to be counted. They create a model to explain differences among chemical elements using graphs to prove concept mastery.
Curated OER
TE Activity: Bubbling Plants
Students study a way to quantify the process of photosynthesis during a given time using the Elodea plant. They design a hypothesis that they test in the hands on activity. They compare the amounts of photosynthesis that occur during low...
Curated OER
Solar Energy in New York
Middle schoolers examine a variety of information for New York State including insolation data, and economic or political data, thus incorporating both science and social studies. Encouraging learners to become concerned citizens as they...
Curated OER
Basic Stats
In this chemistry worksheet, young scholars focus upon the concepts of mean and standard deviation and how it is used in the laboratory to interpret data.
Other popular searches
- Comparing Two Data Sets
- Comparing Sets of Data
- Comparing Related Data Sets
- Comparing Two Sets of Data


