Curated OER
Learning by Sorting
Students sort Lego Duplo pieces after determining the attributes to classify them by. They work in pairs to sort a group of Duplo pieces and explain their process to others.
Curated OER
Measuring Angles
Third graders describe an amount of turn from a particular position to another using the 'circular' benchmarks of 0, ++, ++, ++, and full turn. Estimation language such as 'just about', 'between', 'not quite', 'just over', and similar...
Curated OER
Piece of the Sky: Introduction for Making S'COOL Observations
Students observe and discuss cloud cover. They identify percent of cloud cover, calculate cloud cover by fraction and convert to a percent, and compare their models with the current real sky cloud cover.
Curated OER
Pizza, Pizza
Fourth graders investigate the concept of fractions. A pizza is used as a metaphor and example of practice for students. They use the appropriate methods of dividing numbers from a whole and into the fractional parts. Then students...
Curated OER
Lesson Plan for Fontana Mines
Students estimate and compute with rational numbers. They compare, order and convert among fractions, decimals and percents. Students analyze problems to determine if there is sufficient or extraneous data to solve.
Curated OER
Bearly There
First graders read "How Long Is A Foot?" together and use paper clips, teddy bears, crayons and other non-standard units to measure items. They compare the items measured and order them from longest to shortest.
Curated OER
Converting fraactions and percents
Sixth graders practice the conversion of percents and fractions. They focus on the fact of both fractions and percents are part of a whole. In the independent practice the students also work with solving proportions.
Curated OER
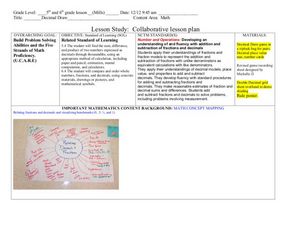
Decimals: Collaborative Lesson
Pupils explore mathematics by participating in a group activity. In this number value lesson, students identify the uses for decimals and how to best estimate whole numbers based on decimals and fractions. Pupils collaborate with...
Curated OER
How Cool Is Your Environment?
Students study the formulas for calculating heat energy and how to convert Celsius to Fahrenheit. They apply the formulas on a worksheet.
Curated OER
Area graphics for 7th graders
Students randomly select dimensions for three geometric shapes (square, right triangle and circle). From the graphs they compare and contrast the graphical results of each shape.
Curated OER
Number Line Math
Second graders use a number line to practice subtraction. For this subtraction lesson, 2nd graders use a number line to count backwards. Students participate in mad math activities and solve problems.
Curated OER
Marking the Minutes
Students mark seconds, minutes, hours, days, etc. on class timetable report to keep track of time spent on Uninterrupted Silent Reading.
Curated OER
The Colored Cube Question
Fourth graders examine how to determine the probabilities or likelihood of outcomes. They complete trials to determine probability while using different manipulatives. They determine how games can be made fair or unfair in this unit of...
Curated OER
Million Dollar Gift
Third graders create a box big enough to hold a million dollars. This is a project fun to do near the winter holidays with inexpensive gifts included in the boxes. This hands-on lesson very effectively demonstrates the concept of volume.
Curated OER
Venn Diagrams & Word Problems
Students explore the concept of Venn Diagrams through word problems. In this Venn Diagram lesson, students solve word problems about groups of people using Venn Diagrams. Students use survey results about MySpace and Facebook in a Venn...
Virginia Department of Education
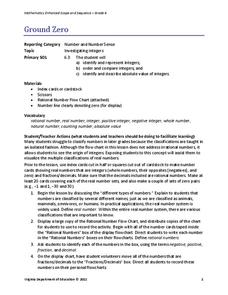
Ground Zero
Don't harbor any negative feelings toward negative numbers. Scholars learn about different classifications of rational numbers, including negative integers. They also develop definitions of the opposite and the absolute value of a...
Curated OER
Comparing Data on Graph A and Graph B
Second graders gather and graph data. In this graphing lesson, 2nd graders collect data and graph this information using tally charts, bar graphs, pictographs, or tables. They make predictions about the outcomes.
Curated OER
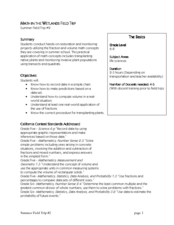
Math in the Wetlands Field Trip
Get your class out in the environment for hands on math activities. In this wetlands lesson, learners transplant native plants, calculate how much soil is needed, and perform math activities based on this experience. They then make...
Curated OER
Reading Trees: Understanding Dendrochronology
Students examine tree-ring dating and discuss the lack of water the settlers in Jamestown faced. They create paper tree rings, simulate rain patterns, and describe the history of construction paper tree sequences.
Curated OER
Smoking: The Real Cost
Third graders discuss the adverse effects of smoking and predict the financial cost of a smoking habit. They collect data regarding the cost of a pack of cigarettes and average packs smoked a day. They create bar graphs displaying the...
Curated OER
Spinner Experiment
Students collect and analyze data, then draw conclusions from the data and apply basic concepts of probability.
Curated OER
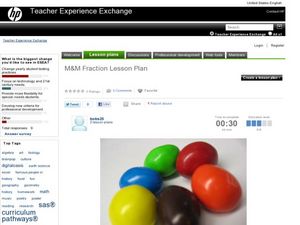
M&M Ratios
Third graders explore ratios. In this probability lesson, 3rd graders sort and count M&M's and identify the ratios of different colors. Students use the attached worksheet as an assessment.
Curated OER
Schoolyard Bird Project
Students observe and count bird sightings around their schoolyard throughout the school year.
Curated OER
Barge Building: What Floats Your Boat?
Students construct aluminum foil boats that float while holding the greatest number of pennies. They investigate the concept of water displacement, record their results, and watch a Bill Nye video on buoyancy.


