Curated OER
Performance-Based Assessment Practice Test (Grade 6 Math)
Keep track of your sixth graders' mastery of the Common Core math standards with this practice assessment. Taking a different approach than most standardized tests, this resource includes not only multiple choice questions, but also...
Curated OER
Beginning Graphs in MS Excel
Young scholars practice creating graphs in Microsoft Excel. In this technology lesson plan, students conduct a random survey and collect data. Young scholars use the Microsoft Excel program to create a bar graph of the data.
Curated OER
How to Graph in Excel
Fourth graders construct data graphs on the Microsoft Excel program. In this statistics lesson, 4th graders formulate questions and collect data. Students represent their results by using Excel.
Curated OER
Publisher Brochures
Students create brochures on subjects they are studying in Publisher. In this nonfiction writing instructional activity, students use Publisher to create a brochure telling all the main ideas of a topic they are studying. Students use...
Curated OER
Tessellations in Excel
Students complete an Excel project on tessellations. In this technology and math lesson, students discuss tessellations and their occurrences in nature. Students use the Excel computer program to create tessellations.
Curated OER
Finding Math In The World Of Art
Students explore the use of Math in the world of Art. In this mathematics and visual art lesson plan, they design a picture using math digits that are camouflaged into a pictures. Additional cross curriculum activities are embedded in...
Curated OER
Geometric Art In Our World
Students explore ways art and math can be blended together in world around them. They recognizes geometric shapes and designs in artwork, and create their own artwork blending the two concepts.
Curated OER
Excel for Beginners
In this Excel lesson, students set a formula to check their homework. Students also use clipart, work in groups, and learn to use the tools in the drop-down list.
Curated OER
Create a Graph Online
Scholars create colorful bar, line, or pie graphs. They decide on a survey question to ask or a type of data to gather. From there, they collect information and data. They display this data in bar, line, or pie graphs that they create...
Curated OER
Waste Watchers
Students recognize the importance of saving energy to save natural resources. In this saving energy lesson, students complete a worksheet to find types of electricity meters in their homes. Students use meter readings to calculate energy...
Curated OER
A Weigh we Go!
Here are some cross-curricular activities whil should help your kids understnad weight measurements and grammar. In this grammar and math lesson, young scholars read the book Skittles Riddles and practice counting and balancing skittles....
Curated OER
Count Around
Students explore counting. For this numeration math lesson, students read a question that poses a "counting" question, count the identified classroom objects, and write their answer on a sticky note. Students place their note...
Curated OER
Those Golden Jeans
Students review the productives resources used to produce goods and services and explore how decisions are made in a market economy through the interactions of both the buyers and the sellers.
Curated OER
Students Speak Up -- Lesson 2
Students define new words such as computer, internet and technology to begin the lesson. In groups, they discuss the definitions with the class and take a survey on the same topics. They discuss the ways technology and the internet can...
Curated OER
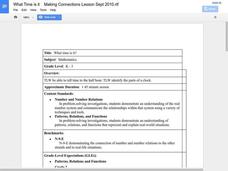
What Time is It?
Pupils explore time by completing worksheets. In this time-telling lesson, students utilize images of clocks and determine what time they read. Pupils answer more clock questions with a Smart Board and complete a clock worksheet with the...
Curated OER
Yummy Apples!
Students discuss apples and how they are grown. They listen as the teacher reads "Apples," by Gail Gibbons. Students discuss the story. They view several different types of apples and compare their characteristics. Students taste several...
Curated OER
Counting Zero to Five
Students are introduced to the numerals zero through five. They associate the numeral with the correct number of objects. Students comprehend the quantities zero through five showing "How many?" by counting their fingers or using a...
Education World
Putting Turkey on a Table (or a Graph)
Grateful learners put turkey on a table (or a graph)! Through a creative project they show statistical information about turkey population, production, and consumption. A great Thanksgiving lesson that can be applied at any time to the...
Curated OER
Let's Count! (Teachers' Page)
Learners practice counting using a website "Let's Count". They point to each object and count and pull down a tab to check their answers.
Curated OER
ZIP Code Math
Students add or subtract to solve ZIP Code Math word problems. A ZIP Code Math work sheet is included. This lesson combines math with geography quite nicely.
Curated OER
THIS WEEK'S WEATHER
First graders create a picture graph representing their town's weather for one week.
Curated OER
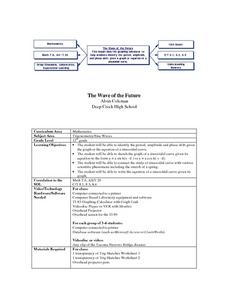
The Wave of the Future
Twelfth graders discuss sine curves and enter equations into their graphing calculator then compare different graphs created on their calculators. They identify the period, amplitude and phase shift given the graph or the equation of a...


