Shodor Education Foundation
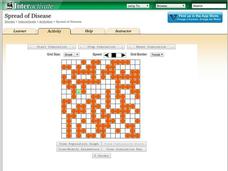
Spread of Disease
Control the spread of a contagious disease. An applet allows pupils to run a simulation on the spread of a disease. Rules govern how the disease is spread and the length of time it takes to recover. Learners view the spread visually and...
Curated OER
Unexpected Answers
Students explore and complete a variety of activities demonstration probability. They make observations about the results of the activities. Students complete and discuss conditional probability. Also, students draw conclusions about...
College Board
2010 AP® Statistics Free-Response Questions
Familiarity with the AP® exam is highly beneficial for test-takers. Scholars use the 2010 AP® Statistics free-response questions familiarize themselves with the test content and format. Studies and experiments, linear regression,...
Curated OER
Probability of a Boy
Learners investigate the concept of even change by participating in a coin flip activity. They research using the Internet to investigate the chance of giving birth to a boy.
Curated OER
Investigation-Design Your Own Spinner
Students design their own spinner that meets the given criteria. In this math lesson, students discuss biased versus unbiased events or outcomes when dealing with probability. Students are given 5 criteria that must be incorporated into...
Curated OER
Rain and Lightning
What are the chances that there will be rain and lighting today? Use this activity to study independent and dependent probabilities with your class. Learners explore the differences between P(A and B) and P(A or B) using mock weather...
Curated OER
What is a P-value?
Students test the hypotheses using p values. In this statistics lesson, students define and examine conditional probability. They test each statement for a true statement or a false statement, based on the sample size.
College Board
2009 AP® Statistics Free-Response Questions
Preparing for a high-stakes test can be highly nerve-wracking, but understanding the test content and format helps ease the anxiety. The 2009 AP® Statistics free-response questions are available for reference. Several topics under...
Curated OER
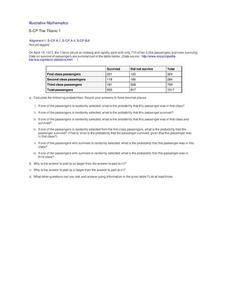
The Titanic 1
Were your chances of surviving the sinking of the Titanic better if you were a first-class passenger? Capture learners' attention with actual historical data to find the answer. They use two-way tables to calculate conditional and...
Curated OER
Investigation - Design Your Own Spinner
Seventh graders use ideas of uncertainty to illustrate that mathematics involves more than exactness when dealing with every day situations. The main standard of this lesson is statistics and probability.
Curated OER
What are the Odds
Students predict the-outcome of an event. In this algebra instructional activity, students compare and contrast the probability of an event occurring. They calculate the odds of a simple event and make estimation.
Curated OER
Unexpected Answers
Students consider probability problems with unexpected and surprising answers.
Curated OER
Torque Me Off
Students investigate the lever and the mathematics associated with levers. They determine the conditions necessary to balance a system of forces around a fulcrum.
Curated OER
Scavenger Hunt
Students collect data about lighting conditions around a room using a light sensor and RCX. They use software to upload and analyze the data in order to draw conclusions about light intensity in the room.
Curated OER
The Titanic 2
Did the rescue procedures on the Titanic favor the first-class passengers? Use actual historical data to explore independent and dependent events with your class. Part of a series of worksheets, but can be used separately.
College Board
Power in Tests of Significance
Test your knowledge of tests of significance. A curriculum model for AP® Statistics describes and defines power in terms of tests of significance. It also provides two classroom activities designed to investigate power and how it relates...
Intel
Energy Innovations
Collaborative groups examine the importance of energy resources on quality of life by researching different energy sources and alternative energy sources through data analysis. They make a comparison of different countries and cultures,...
Intel
What Does This Graph Tell You?
What can math say about natural phenomena? The fifth STEM lesson in this project-based learning series asks collaborative groups to choose a phenomenon of interest and design an experiment to simulate the phenomenon. After collecting...
Curated OER
"Eggs-ploring" Math with Jellybeans
Learners work in pairs with a small bag of jellybeans to estimate the number of candies in their bags and then figure out how many groups of 10 jellybeans are contained in their bags. They then graph the information using a pictograph or...
Illustrative Mathematics
Do You Fit In This Car?
A short activity that focuses on the normal distribution as a model for data distribution. Using given means and standard deviations, your budding statisticians can use statistical tables, calculators, or other statistical software to...
Curated OER
Antacid Tablet Race
Students complete experiments to determine how rocket fuel is affected by surface area and temperature. They compare the reaction rates of antacid tablets. They discuss their results to complete the lesson.
Curated OER
Interpreting a Pictogram
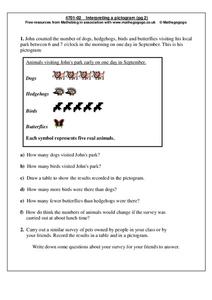
In this pictogram learning exercise, students read and analyze a pictogram about dogs, hedgehogs, birds and butterflies and then answer 6 short answer questions. Students conduct a similar survey on pets owned by their friends and put...
Curated OER
Is the Hudson River Too Salty to Drink?
Students explore reasons for varied salinity in bodies of water. In this geographical inquiry lesson, students use a variety of visual and written information including maps, data tables, and graphs, to form a hypothesis as to why the...
Curated OER
Mean, Standarad Deviations, and Variances
In this Statistics instructional activity, 11th graders compute the mean, standard deviation and variances for four different problem scenarios. The one page instructional activity contains four scenarios, each with eight questions. ...


