Curated OER
Creating Bar Graphs
Fifth graders design and label a bar graph using data taken from a class survey. They observe a teacher-led lecture, write and conduct their survey, and create a bar graph that includes identification of the minimum, maximum, mode,...
Curated OER
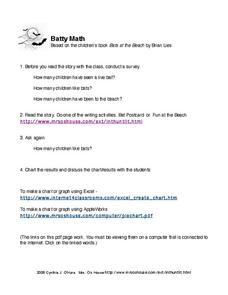
Batty Math
In this bats worksheet, students click on the link to read a story about bats and then answer short answer questions, take a survey, and create graphs about it. Students complete 4 tasks total.
National Security Agency
Going Green with Graphs
In this unit designed for second graders, youngsters are introduced to conducting surveys and creating tally charts based on the data they gather. Students then construct bar graphs, and observe the relationships between the two types of...
Curated OER
Graph It!
There is more than one way to represent data! Learners explore ways to represent data. They examine stacked graphs, histograms, and line plots. They conduct surveys and use stacked graphs, histograms, or line plots to chart the data they...
Curated OER
Rescue Mission Game
Students conduct probability experiments. In this rescue mission lesson plan, sudents play a game and collect statistical data. They organize and interpret the data and determine the probability of success. Students plot points on a...
Beyond Benign
House Project Overview
What does your perfect house look like? Pupils design a sustainable house given certain specifications. They create concept maps that detail the math skills they need to use while considering their designs.
California Education Partners
Colorful Data
Scale up your lessons with a performance task. Young data analysts work through an assessment task on scaled bar graphs. They answer questions about a given scaled bar graph on favorite colors, analyze a bar graph to see if it matches...
Curated OER
The Left-Handed Experiment
Fifth graders work together to develop a survey to determine the number of left-handed students in their school. In groups, they administer the survey, calculate and discuss their results. To end the activity, they discuss ways to...
Curated OER
The Human Line Plot
Fifth graders collect data and use charts and line plots to graph data. Through class surveys, 5th graders collect data concerning a particular subject. They graph their data using a line graph. Students make inferences and predictions...
Curated OER
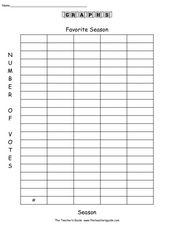
Favorite Season
In this graphing worksheet, students conduct a survey of people's favorite survey. They then complete 8 questions about the data gathered before creating a bar graph and pictograph on templates.
Curated OER
Graphing in the Form of Bar Graphs
Learners explore bar graphs. In this math lesson, students create and conduct a survey. Learners graph their data in a bar graph.
Curated OER
Heart to Heart
Students predict the outcome of a question and conduct a survey and record their findings on a bar graph.
Curated OER
Class Ketchup
Learners describe statistics by conducting a class cooking activity. In this ketchup lesson, students conduct a class survey based on ketchup consumption habits by learners. Students utilize tomatoes, water and a bottle to create their...
Curated OER
Statistics with M&Ms
Seventh graders explore estimation, measurement, and probability. Students conduct surveys and create charts & graphs. They study the history of chocolate. Students design their own magazine advertisement or create a script for a...
Curated OER
Play It
There are a number of activities here that look at representing data in different ways. One activity, has young data analysts conduct a class survey regarding a new radio station, summarize a data set, and use central tendencies to...
Shodor Education Foundation
Replacement and Probability
Middle and high schoolers explore the concept of probability. In this probability lesson, learners conduct an experiment with a bag of marbles. Pupils draw marbles from a bag and determine the probability of drawing a particular color...
National Security Agency
Line Graphs: Gone Graphing
Practice graphing and interpreting data on line graphs with 36 pages of math activities. With rationale, worksheets, and assessment suggestions, the resource is a great addition to any graphing unit.
Curated OER
And Around We Go!
Sixth graders conduct a survey and collect data to construct a bar graph that will then be changed into a circle graph. With the bar graph, 6th graders compare estimated fractions and percentages and estimate percentages. With the circle...
Curated OER
A Pocketful of Change
Pupils study the meaning, symbolism, and value of U.S. coins,
especially the quarter. They conduct a survey of coins in students'
possession, graphing the results to show frequency distribution and drawing
inferences about the U.S....
Curated OER
Calculating Theoretical & Experimental Probability
High schoolers explore the concept of experimental and theoretical probability. In this experimental and theoretical probability lesson plan, students collect data by conducting a survey of their classmates. High schoolers compare their...
Curated OER
Follow a Bill!
Pupils participate in an activity to discover how a bill becomes law in California. In groups, they create a school program based on their own ideas for change. They develop and conduct a survey within their community and present their...
Curated OER
U-G-L-Y? I've Got a Great Alibi
Students create a survey to explore people's perception of beauty. In this biology instructional activity, students explain how an animal's appearance helps it survive. They analyze survey results and present findings in class.
Curated OER
Technobiz
Students examine candy preferences to create a plan in order to improve candy sales. In this technobiz instructional activity, students build spreadsheet and organizational skills by graphing and calculating data. Students are introduced...
Curated OER
A Picture is Worth a Thousand Words
Sixth graders work to write questions for a class survey. In this survey lesson, 6th graders survey their class members by asking the 4 questions they developed and will record their answers on the culminating assessment provided by the...


