Curated OER
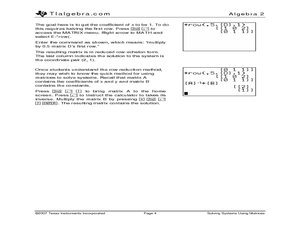
Solving Systems Using Matrices
Explore the concept of systems of equations in two variables and use matrices to solve them. Young mathematicians enter coefficients and constants into a matrix and then solve using row reduction. Instructions on how to use the shortcut...
Curated OER
The Atlatl System
Fifth graders are introduced to the atlatl system and how to test and control variables. In groups, they use the Internet to research how the system has changed over time. They test various variables and record their results in a graph...
Curated OER
The Scientists’ Way
Students summarize the steps of the scientific method. For this life science lesson, students explain the importance of varying only one variable at a time. They analyze possible flaws in their experiment.
Curated OER
Coefficient of Restitution
Students investigate variables that influence the bouncing of balls. In this exploratory lesson students observe how the manipulated and control variable are correlated by graphing the data.
Curated OER
Experimenting with Motion
Pupils study motion and how different variables can change the outcome. In this motion lesson students answer questions about their experiment and see what the different variables did.
Curated OER
Computing Concepts with Java 2 Essentials
Students identify with various programming texts; introduce material in different orders; and emphasize different concepts. Students read an introduction to LiveTexts; complete various activities; discover and apply its Global features...
Curated OER
Environmental Graphing
Students experiment with graphing. In this graphing introduction lesson, students complete four activities: 1) a bar graph based on class birthdays 2) an estimation graph of the raisins in raisin bread 3) another estimation example with...
Curated OER
Marble Madness
Students determine the velocity of a marble rolling down the incline. In this physics instructional activity, students identify the independent and dependent variables in the experiment. They construct and analyze a graph.
Curated OER
Which Tape is Stickiest?
Students conduct an experiment to determine which style of tape will stick the best. In this controlled experiment lesson, students predict which tape will stick best to a marble that rolls over it, then they conduct the experiment...
Curated OER
Mutations--Preexisting or Acquired?
Students state the controls and variables of the Newcombe spread experiment. They state a hypothesis for the Newcombe spread experiment. Students distinguish between the characteristics of a preexisting mutations and those of an...
Curated OER
How Much Sugar is in Bubble Gum?
Students conduct an experiment to determine the percentage of sugar in various types of gum. They weigh the gum after chewing it to determine the amount of mass lost from each piece of gum, analyze the data, and create a graph of the...
Curated OER
Variables That Can Affect Making Schedule
Students study the variables that affect transportation of shipments and the factors that affect deterioration of a perishable product. In this transportation lesson students discuss the pros and cons of team driving.
Can Teach
Line Drawing Obstacle Course
Students practice their pencil holding and controlling skills.
Nuffield Foundation
Investigating Osmosis in Chickens' Eggs
You might not be able to learn through osmosis, but you sure can observe it! Scholars observe and measure osmosis using chicken eggs. They control for multiple variables to determine which variables have an impact and how the impact...
Curated OER
Scientific Method: How Many Drops of Water Fit on a Coin?
Young investigators conduct an experiment using the scientific method. They see how many drops of water fit on a coin; have them conduct several different trials. This involves making a hypothesis, looking at controls, and introducing...
Perkins School for the Blind
The Germinator
How does a plant grow from a seed? Observe the process with a clever idea from the PBS television show ZOOM. Watch the video, then have your young botanists create their own germinators. The lesson described here is for visually impaired...
Curated OER
The Abiotic Limits to Purple Loosestrife Growth
Young scholars investigate the effects of soil temperature, water availability, photo period and other variables of the growth of purple loosestrife. They observe the growing conditions of plants and alter them by adding water, isolating...
Curated OER
Examine the Data
Seventh graders examine a teacher-created database and identify specific variables and develop hypothesis statements as to their possible effect. They create a summary statement either proving or disproving their hypothesis.
Curated OER
Measuring Temperature and the Production of CO2 in Yeast
Young scholars use a model experiment to complete an experiment on yeast. In groups, they identify the independent and dependent variables and use the scientific method to complete the activity. They record their observations and discuss...
Curated OER
Testing the Accuracy of a Rain Gauge
Students identify and test variables that may affect the accuracy of a rain gauge. They share findings of their research with the class in a 'mini-meteorology-convention'. They design an experiment with a control setup to test their...
Curated OER
BEETLES: The Coming Out
Students design an experiment to test the variables involved in the hatching of the Bruchid beetle.
Curated OER
Graphing Pendulum Results
Sixth graders set up a pendulum experiment deciding which variable to manipulate (length of string or weight on the string). They create a hypothesis, collect necessary equipment, and write out each step of their experiment. They then...
Curated OER
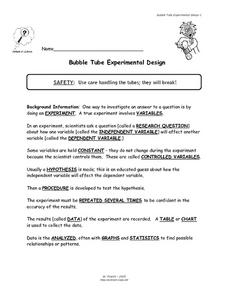
Bubble Tube Experimental Design
Students study what an experiment is comprised of and how to be successful when doing an experiment. In this experimental lesson plan students design their own experimental investigation and answer questions.
Curated OER
Point Graphs
Students experiment with point graphs. In this math instructional activity, students are divided into groups and perform an experiment to see how high a ball bounces, recording their results on a point graph. Students then answer...


