EngageNY
The Graph of a Linear Equation in Two Variables
Add more points on the graph ... and it still remains a line! The 13th installment in a series of 33 leads the class to the understanding that the graph of linear equation is a line. Pupils find several solutions to a two-variable linear...
Education Development Center
Geography of the Coordinate Plane
Put the graph into graphing and allow learners to understand the concept of point plotting and how it relates to data. The worksheet provides a nice way to connect data analysis to a graph and make predictions. The worksheets within the...
Curated OER
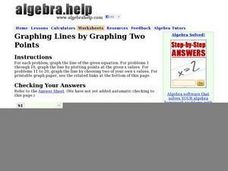
Graphing Lines by Graphing Two Points
Use a graphing lines worksheet to have your mathematicians graph the line of a given equation and plot specified points. The first 10 problems have a given equation, and two values. The next 10 problems have a given equation, but your...
EngageNY
The Graph of a Linear Equation—Horizontal and Vertical Lines
Graph linear equations in standard form with one coefficient equal to zero. The lesson plan reviews graphing lines in standard form and moves to having y-coefficient zero. Pupils determine the orientation of the line and, through a...
Regional Professional Development
Solving Systems of Equations by Graphing
With 30 problems, each accompanied by a blank graph, pupils get thorough practice solving systems of equations by graphing and finding the point of intersection. Answers are provided in coordinate form.
Curated OER
Linear Functions: Slope, Graphs, and Models
This math packet provides an opportunity for learners to graph two linear equations on a coordinate grid and determine the slope and y-intercept of each. They use the equation of five lines to find the slope and y-intercepts, and then...
Curated OER
Graphs
For this algebra worksheet, students solve three linear equations to by substitution to determine if the given point is a solution. Students graph and determine the slope and y-intercept of 5 linear equations.
Curated OER
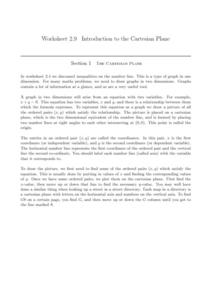
The Cartesian Plane
Learners solve and complete 22 various types of problems. First, they find the gradients of the lines and plot the given points. Then, they complete the table of values for each equation and use the table to draw the graph.
Curated OER
Graphs: Linear Functions
In this linear function worksheet, students use tables to find the values of functions. They graph linear functions and explore the significance of the coordinates. This two-page worksheet contains 4 multi-step problems. Graph paper is...
Curated OER
Interpret Graphs of Ordered Pairs
Middle and high schoolers solve four word problems based on three different graphs of ordered pairs which show the amount of money spent on lunch on particular days. Next, learners are given two equations of functions, and an x value and...
CPM
Tables, Equations, and Graphs
Eighth and ninth graders solve and graph 24 different problems that include completing input/output tables and graphing the pairs. First, they find the missing values for each table and write the rule for x. Then, students write the...
Curated OER
2D-Graphing Functions
Practice graphing basic equations. Algebra learners complete a table showing values of x and y. They graph the results on a coordinate grid. There are six problems: three equations are linear, and three are quadratic. The "show your...
Curated OER
Graphing Linear Equations
In this graphing linear equations worksheet, students plot 22 lines on their coordinate grids. When directions are followed carefully, the result is a picture.
EngageNY
Perimeter and Area of Polygonal Regions in the Cartesian Plane
How many sides does that polygon have? Building directly from instructional activity number eight in this series, learners now find the area and perimeter of any polygon on the coordinate plane. They decompose the polygons into triangles...
Teach Engineering
Graphing Equations on the Cartesian Plane: Slope
Slopes are not just for skiing. Instructors introduce class members to the concept of slope and teach them how to calculate the slope from a graph or from points. The lesson also includes the discussion of slopes of parallel and...
EngageNY
Perimeter and Area of Triangles in the Cartesian Plane
Pupils figure out how to be resourceful when tasked with finding the area of a triangle knowing nothing but its endpoints. Beginning by exploring and decomposing a triangle, learners find the perimeter and area of a triangle. They then...
Virginia Department of Education
Graphing Linear Equations
Combine linear equations and a little creativity to produce a work of art. Math scholars create a design as they graph a list of linear equations. Their project results in a stained glass window pattern that they color.
EngageNY
The Graph of a Linear Equation in Two Variables Is a Line
Show your class that linear equations produce graphs of lines. The 20th segment in a unit of 33 provides proof that the graph of a two-variable linear equation is a line. Scholars graph linear equations using two points, either from...
EngageNY
Every Line is a Graph of a Linear Equation
Challenge the class to determine the equation of a line. The 21st part in a 33-part series begins with a proof that every line is a graph of a linear equation. Pupils use that information to find the slope-intercept form of the equation...
Curated OER
Graphing From Function Tables
In this graphing from function tables worksheet, students graph given functions from a completed function table. This is a worksheet generator, the teacher can set the grid size for plotting points as well as whether or not to include a...
Curated OER
Twenty-Seven Graphing Lines, Parabolas, and Absolute Value Problems
Have learners find coordinates of point on a graph, find equations of graphs given, and graph given equations using in and out tables. There are 27 problems related to equations for lines, parabolas, and absolute value functions.
National Council of Teachers of Mathematics
Stitching Quilts into Coordinate Geometry
Who knew quilting would be so mathematical? Introduce linear equations and graphing while working with the lines of pre-designed quilts. Use the parts of the design to calculate the slope of the linear segments. The project comes with...
Curated OER
Tables and xy-Coordinates
Use this graphing functions activity to have learners complete four tables and graph the results on the included coordinate grid.
Curated OER
Coordinates
In this coordinates worksheet, students analyze two maps and identify the coordinates of ten specific locations. Students plot sixteen points on a graph and check their answers online at the end of each exercise.
Other popular searches
- Coordinate Graphing Pictures
- Holiday Coordinate Graphing
- Graphing Coordinate Planes
- Coordinate Graphing Worksheets
- Cartesian Graphing Pictures
- Coordinate Graphing Art
- Using Coordinate Graphing
- Coordinate Graphing Practice
- Algebra Coordinate Graphing
- Coordinate Graphing Distance
- Graphing Coordinate Pairs
- Graphing on a Coordinate Grid


