Illustrative Mathematics
Weather Graph Data
Teaching young mathematicians about collecting and analyzing data allows for a variety of fun and engaging activities. Here, children observe the weather every day for a month, recording their observations in the form of a bar graph....
Curated OER
Creating a Thematic Map
Students create and analyze a weather-related data table and a thematic map based upon information provided.
Curated OER
Virus and Bacteriophage
Students examine the differences between a virus and a bacteriophage. They explore various websites, identify the parts of a virus and a bacteriophage, and construct a model of a virus or bacteriophage.
Curated OER
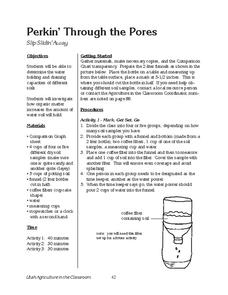
Perkin' Through the Pores
Young scholars investigate how organic matter increases the amount of water soil will hold. In this water soil lesson plan, students use soil and measure water amounts using organic matter. Young scholars measure the water holding...


