Centre for Innovation in Mathematics Teaching
Ten Data Analysis Activities
This thirteen page data analysis worksheet contains a number of interesting problems regarding statistics. The activities cover the concepts of average measurements, standard deviation, box and whisker plots, quartiles, frequency...
David Pleacher
Candy Math Fun
Few things can motivate children to learn like the promise of a sweet and tasty treat. Given a bag of M&M®s, Skittles®, or other colorful candy, students first predict the contents of the bag before counting the pieces,...
American Statistical Association
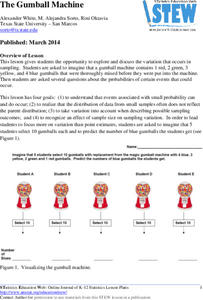
The Gumball Machine
Chew on an activity for probability. Given information on the number of gumballs in a gumball machine, scholars consider how likely it is to randomly draw a blue gumball and how many of each color they would draw in 10 trials if the...
Rice University
College Algebra
Is there more to college algebra than this? Even though the eBook is designed for a college algebra course, there are several topics that align to Algebra II or Pre-calculus courses. Topics begin with linear equation and inequalities,...
EngageNY
Using Sample Data to Estimate a Population Characteristic
How many of the pupils at your school think selling soda would be a good idea? Show learners how to develop a study to answer questions like these! The instructional activity explores the meaning of a population versus a sample and how...
Curated OER
Capture/Recapture
Students use proportions to estimate the size of populations. They describe the data with using a graph or table of the estimate. Students use descriptive statistics to calculate mean, median, and mode. They also compare and contrast an...
Curated OER
Single and Compound Events
In this single and compound events worksheet, 8th graders solve 10 different problems related to various single and compound events. First, they determine the probability of getting ace and a king card without replacement. then, students...
Curated OER
Single and Compound Events
In this single and compound events worksheet, 8th graders solve 10 different problems that contain various single and compound events. First, they determine the probability of selecting an ace and a king without a replacement. Then,...
Curated OER
Combinations
In this probability worksheet, students use permutation and combination to calculate the number of outcomes. They differentiate between the two. There are 2 questions with an answer key.
Curated OER
Probability or Ability?
Students use their non-dominant hand to catch candy which they tossed in the air. They estimate how many they catch in a second round. They record and determine how the probability changed the second time.
Curated OER
Dice Games
Games and activities are wonderful for igniting interest in nearly any topic. With a pair of dice, your class will practice their basic math and social skills at the same time. Learners battle it out to see who can roll only odds or only...
Curated OER
Probability
In this probability activity, 8th graders solve 10 different problems that include determining various events of probability. First, they determine the odds of an event given the ratio. Then, students use a fraction to express the...
Virginia Department of Education
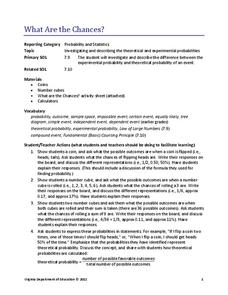
What Are the Chances?
Take a chance on an informative resource. Scholars conduct probability experiments involving coins and number cubes to generate data. Compiling class data helps connect experimental probability to theoretical probability.
Curated OER
Does My Vote Count? Teaching the Electoral College
Pupils comprehend the purpose, function, origin, and historical development of the electoral college. They evaluate issues of fairness and representation in the electoral process, both individually and through group discussion. Students...
101 Questions
Yellow Starbursts
Let the task burst your mind. Scholars estimate the frequency that both Starbursts in a pack are yellow out of 287 packs. They apply probability concepts to complete the sweet task.
National Shooting Sports Foundation, Inc.
How Many “Un-endangered Species” Do You Know?
Can endangered species become un-endangered? Of course! Examine six lucky animals whose populations once were dwindling, but now are healthy and thriving. Learners match animal images to brief descriptions, complete a true/false activity...
American Statistical Association
How Tall and How Many?
Is there a relationship between height and the number of siblings? Classmates collect data on their heights and numbers of brothers and sisters. They apply statistical methods to determine if such a relationship exists.
Curated OER
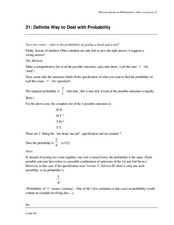
Misconceptions in Mathematics: Misconception 21
In this mathematics misconceptions worksheet, students examine examples of math mistakes pertaining to probability and explore the reasons that the examples are incorrect.
Curated OER
Quiz: Single and Compound Events
In this single and compound event worksheet, students read given statements and determine the probability of each event. Statements include data dealing with cards in a deck, coins and dice. Students solve both simple and compound...
Curated OER
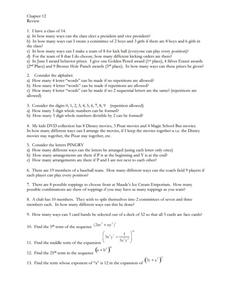
Combinations and Sequences
In this combinations review worksheet, students answer 5 multi-step short answer questions involving combinations. Students then answer 15 questions regarding combinations, sequences, and terms. Students also answers 15 probability...
Curated OER
What's the Chance?
Students conduct probability experiments with dice and coins. They watch a video for a variety of situations where calculating the probability is complicated by total number of possibilities. They solve problems presented in the video.
Curated OER
Brain Teaser
In this statistics activity, students solve word problems using their probability and how many times an event may or may not occur. This activity contains 54 questions that are all word problems.
Curated OER
Mathematics Witing: Algebraic Processes and Its Connections to Geometry
Students, using manipulatives, determine how many different ways there are to arrange 3 and 4 objects. They organize and record their arrangements. Students investigate the pattern generated by 3 and 4 objects, they predict how many ways...
Curated OER
Expected Outcome
Students determine expected values of experiments and explore distributions of experiments. They guess as to how many times a coin will flip heads in fifty tries. They flip a coin fifty times graphing the results on a histogram. They...


