Curated OER
Picture Board
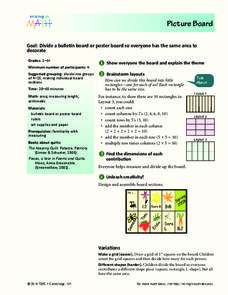
Learners divide a poster board so everyone gets the same amount of area to decorate. Youngsters talk about the different ways to divide a rectangle. They measure their lines to make sure that each piece is equal and then decorate their...
Curated OER
Money
Students practice counting money. In this counting and comparing money activity, students review the value of coins and use play money to count out five dollars. Students complete a worksheet to determine what items they...
Curated OER
Race to the Top
Here is a game that will help your young mathematicians practice number recognition and writing numbers. Played with a spinner or dice, individual learners or a pair will play this fun number game. They will roll the die or spin the...
Curated OER
Class Birthday Graph
Students analyze the basics of an Excel spreadsheet. They highlight cells in a spreadsheet. They make a column graph. Students are introduced to X-axis and Y-axis. They play various address games on the spreadsheet.
Curated OER
Ten More and Ten Less
Get learners to analyze two-digit numbers based on place value, and use manipulatives to add and subtract both 1 and 10. A place value chart is available, and you can project it during guided practice. Through visualizing...
Federal Reserve Bank
Glo Goes Shopping
Making decisions can be very difficult. Show your class one way to evaluate choices with this lesson, which is inspired by the book Glo Goes Shopping. Learners practicing using a decision-making grid with the content of the story and a...
Curated OER
ROV Grid Search
Pupils perform activities to recreate the exploration of the sea bottom. They attach magnets to the bottom of the remote controlled car to see how many camouflaged objects it can pick up. As a class, students examine the results of...
Curated OER
You Can Count on Squares!
Fourth graders engage in and explore to develop mathematical, specifically algebraic, ideas. Although the tasks are built around measurement, they are algebraic to the extent that they require 'formulae' to be derived form the geometric...
Curated OER
Mathematics Within: Algebraic Processes and Its Connections to Geometry
Fifth graders discover the connections between algebra and geometry. With a focus on arrays and factors, they are introduced to multiplication. They develop an array for multiples of 2 through 10 and identify the factors of each row....
Curated OER
Arrays Hooray
Second graders write and solve story problems which involve whole numbers, using addition, subtraction, multiplication, or division. They solve multiplication problems by using strategies other than counting all. They interpret and solve...
Curated OER
Rice Cookies Addition
Fourth graders practice adding rice cookies. In this mental math lesson, 4th graders get into groups and call out numbers to each other to add mentally. Students use the rice cookies to show the answer.
Curated OER
Pet Count Excel Graphing
Students used collected data to distinguish what pets they have or would like to have. They correlate findings with appropriate technology--Excel. At the end of the lesson they tabulate a bar chart and present their findings to the class.
Curated OER
Name Count and Graph
Students find the frequency of a name in selected states by using the Internet. They input data into a spread sheet. They create a graph that illustrates the gathered information.
Curated OER
Array to Go!
Second graders are introduced to arrays as a means for multiplication readiness. Once students are comfortable with naming the array by counting the columns and rows, they integrate skip counting.
Curated OER
Math: Collecting and Analyzing Date
Children count how many of an activity they can do in a row, such as ball tossing and record the date and count. Children track over a period of time and graph results.
Curated OER
Little Magic Squares
Students and teacher talk about arrays of numbers like the ones in A Square of Circles. They check to see that the rows all have the same sum; that the columns all have the same sum; and that the diagonals have the same sum.
EngageNY
Summarizing Bivariate Categorical Data in a Two-Way Table
Be sure to look both ways when making a two-way table. In the lesson, scholars learn to create two-way tables to display bivariate data. They calculate relative frequencies to answer questions of interest in the 14th part of the series.
EngageNY
Problems in Mathematical Terms
Whether scholars understand independent and dependent variables depends on you. The 32nd installment of a 36-part series has learners analyze relationships in real-world problems through tables. They determine independent and dependent...
Curated OER
Hershey Chocolate Fractions
In order for students to acquire knowledge about math concepts, and in particular fractions, they need concrete ways to practice an abstract concept.¿¿¿ Using Hershey bars builds on prior knowledge as most students have probably...
Curated OER
Study Buddies: Dividing by Two-Digit Numbers/One-Digit Quotients
In this math worksheet, students will work with a coach to solve a two-digit division problem. Students will follow a step-by-step process and notes are provided for the coach.
EngageNY
Writing and Evaluating Expressions—Multiplication and Division
Don't table the resource on writing expressions for relationships in tables. Scholars investigate relationships between variables and write algebraic expressions involving multiplication and division. These expressions help solve...
World Wildlife Fund
Shapes
Investigate the properties of three-dimensional figures with this Arctic-themed math lesson plan. Beginning with a class discussion about different types of solid figures present in the classroom, young mathematicians are then given a...
Curated OER
Investigating Square and Triangle Numbers
Fifth graders build increasingly larger squares and triangles using pattern blocks. They record the growth patterns on a chart and look for corresponding numerical patterns. Students describe the patterns they find and use them to...
Curated OER
Build a Bar Graph
Learners discover how to use bar graphs. They will gather and organize specific data in order to put it into a bar graph. Then they will answer several questions based on the information they have graphed.


