Curated OER
Dynamite Data
Second graders rotate through a variety of stations designed to offer practice in manipulating data. They sort, tally and count items and then create bar graphs, tables, and pie graphs to record their findings.
Curated OER
Technology Literacy Challenge Grant Learning Unit
First graders explore counting and classification. They sort leaves, create graphs, write sentences for the data in the graphs, develop graphs for shapes, favorite animals, birthdays, and participate in a die prediction game.
Curated OER
Math on a Roll
Students practice various math skills using a polyhedral die. For this dice game lesson, students practice multiplication, addition, place value, and money using games. Standard dice may be used instead of a polyhedral die with...
Curated OER
Olympic Medal Count
In this Olympic medals worksheet, students identify the country's flag and write the country name in the box next to it. Students add the country's abbreviation and watch the Olympic Games. Students put a mark in the appropriate box when...
Curated OER
How Many Ways?
Second graders develop number sense. In this number sense lesson plan, 2nd graders use multiple ways to represent numbers including written numerals, tally marks and manipulatives. Students correctly use place value to the thousands place.
Curated OER
Math: Counting on Others
Learners use counting skills to decide who wins the Classroom Winter Games. They use numeral writing and tally marks to keep score. Students have an opportunity to pretend they are competing for medals in the Winter Games while using...
Curated OER
Build a Bar Graph
Learners discover how to use bar graphs. They will gather and organize specific data in order to put it into a bar graph. Then they will answer several questions based on the information they have graphed.
Curated OER
Dental Detectives
First graders explore the theme of dental health and hygeine. They make tooth loss predictions, count lost teeth, and graph tooth loss. In addition, they listen to dental health stories, read online stories, create spreadsheets, and play...
Curated OER
Tally Time
Students create a tally chart. In this math and health lesson plan, students discuss healthy foods and create a tally chart showing the number of students who like to eat healthy foods.
Curated OER
A is for Apple
Learners participate in a variety of activities to learn about apples. Students graph apples, learn about apple uses, taste apples, and observe what happens when apples are dipped in lemon juice.
Curated OER
Collect and Organize Data: Homework
In this collecting and organizing data learning exercise, students use the tally chart for the students' eye color to answer the first two questions. Students then survey their family for eye color, record those results in a tally chart,...
Curated OER
Make a Bar Graph
For this bar graphs worksheet, students use the tally chart to make a bar graph. Students color one box for each tally mark and then use the chart to help answer the questions about the sunny, cloudy, and rainy days.
Curated OER
Organize Data
In this organizing data worksheet, students complete the tally chart for 'Votes for Team Mascot' and then use the chart to answer the six questions.
Curated OER
Pumpkin Seed Experiment
For this unique lesson pupils participate in a pumpkin seed experiment. Students interact with the pumpkins weight, seeds and record their findings of what lies within the pumpkin once the top of the pumpkin is cut off for observations....
Curated OER
Buzzing is BEE-lieving
Students investigate insects. In this insect lesson, students explore various insect models and identify the characteristics of each. Students observe insects outside and tally how many insects they observe.
Curated OER
Heads or Tails?
In this probability worksheet, 1st graders toss a penny in the air 5 times and fill in a chart on how many times it landed heads up and/or tails up. Students complete this activity three times.
Curated OER
All About Graphs
Students practice organizing data by creating graphs. In this statistics instructional activity, students survey the class about favorite colors and create a bar graph using the data. Students complete a test based on pet and animal...
Virginia Department of Education
Mathematics Vocabulary Cards - Kindergarten
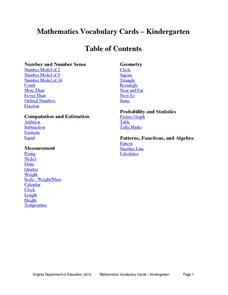
Enhance your math lesson with a series of pictures that illustrate different math concepts. The vocabulary includes a variety of ideas and pictures including fractions, ordinal numbers, picture graphs, and number lines.
Curated OER
Range and Mode
Students interpret data from graphs. In this range and mode lesson, students review a tally chart, pictograph and bar graph. Students use these graphs to calculate the range and mode of each set of data.
Curated OER
Shoeless Math
First graders sort and classify, and complete a T-chart using Students' shoes.
Curated OER
Stone Soup
Students create a list of ingredients after counting the ingredients in Stone Soup.
Curated OER
Plastic Parade: Recycling
In this recycling worksheet, students use ten plastic containers, collect data on the recycle number on each one, and conclude if most plastics are or are not recyclable in their town.
Curated OER
Recording Data From a Survey Reteaching Worksheet
In this recording data from a surveys reteaching instructional activity, 2nd graders review the use of tallies when recording data. They use the information to make a data table and a bar graph that displays the information.
Curated OER
Calendar Communication
Students identify days, dates, and month on a calendar. In this calendar instructional activity, students use a blank calendar page and fill in the days of the month. Students recall what they learned on specific days and record that...


