Curated OER
Jellybean Graphs
Second graders predict and graph data based on the color of jelly beans they think are in a handful. In this prediction lesson plan, 2nd graders will predict how many of each color jellybean are in a handful. Then they graph these...
Curated OER
Immigration Graphs
Fourth graders study immigration. For this graphing lesson, 4th graders make a population graph of people who have immigrated to Indiana.
Curated OER
Foliage Tracker
Young scholars discuss the change of leaf colors and the role that climate and elevation play in those changes. They then track leaf changes, input data, and graph foliage changes with a free online tool.
Mathematics Vision Project
Module 3: Polynomial Functions
An informative module highlights eight polynomial concepts. Learners work with polynomial functions, expressions, and equations through graphing, simplifying, and solving.
Curated OER
Button Bonanza
Collections of data represented in stem and leaf plots are organized by young statisticians as they embark some math engaging activities.
Curated OER
Survey Says
Pupils complete a survey questionaire and total the responses. They create a game like Family Feud with the top answers. They create a bar graph of one of the questions after the game is finished.
Curated OER
Tree Measurement
Students work in pairs taking measurements of a tree. They measure the trunk, crown, and height using vertical and horizontal measurement. Then students create a bar graph using the information they gathered.
Curated OER
Budget Making
After analyzing a pie graph of national spending, high schoolers express their opinions on priorities for national spending. They create a new bar graph and mail it to their congressional representative with recommendations about needed...
K20 LEARN
Let's Lasso the Moon: Phases of the Moon
A timelapse video hooks learners' attention to the phases of the moon. After discussing their observations, pupils use the Moon Giant website to view the moon on their birthday and complete a bar graph. The class creates an anchor chart...
Los Angeles County Office of Education
Assessment For The California Mathematics Standards Grade 6
Test your scholars' knowledge of a multitude of concepts with an assessment aligned to the California math standards. Using the exam, class members show what they know about the four operations, positive and negative numbers, statistics...
Radford University
How Is Your Gender Represented?
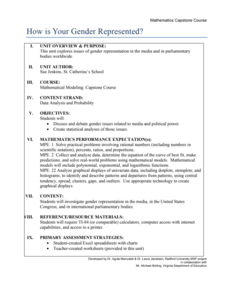
Does the media shape people's views on gender? Scholars use data on gender portrayal in magazines to explore the idea. They use a spreadsheet program to create bar graphs and perform a chi-square test. They also use provided data to...
Curated OER
Excel Lesson Plan Coin Statistics
Second graders determine the difference between making a prediction and determining actual information. They design a spreadsheet for a coin flipping activity on which they include their predictions and what actual happens when they flip...
Curated OER
Getting the Lead Out
The article for this lesson no longer accessible through the links in the lesson plan, but can be found in the National Center for Biotechnology Information website. After reading it, environmental science students answer questions and...
Curated OER
Fuel Mystery Dis-Solved
Students describe how temperature and surface area exposure affect the rate at which fuel is consumed. They explain why engineers want to know about the properties of a fuel when designing rockets. They create a bar graph of result data.
Curated OER
Graphing Fun In Third Grade
Third graders display information in a graph, table, and chart. In this data lesson plan, 3rd graders look at graphs, tables, and charts, discuss their importance, and make their own.
Curated OER
Fossils: The Eras of the Earth's History
Learners research the four geologic eras of Earth's history. In this extension on a fossils lesson, students research the different eras of Earth's history. Learners use AppleWorks to create a bar graph containing information of the four...
Curated OER
Graphing Data on Ellis Island
Third graders use data to make a bar graph. In this graphing and social studies lesson, 3rd graders use data about where Ellis Island immigrants came from to complete a bar graph on Microsoft Excel.
Curated OER
Graphing Favorite Colors
Third graders collect data and insert it into ClarisWorks to create a spreadsheet/graph of their favorite color. They interpret the data together.
Curated OER
Where Do I Fit on the Graph?
Young scholars collect data and create graphs about themselves, their community, and the world around them. They use a variety of methods to organize data, such as stickers, clothespins, name tags, coloring, tally marks, etc.
Curated OER
Creating a Graph
Students brainstorm favorite things to do during the summer. They survey classmates to collect data, arrange it in a chart, and create graphs using ClarisWorks.
Curated OER
Using Excel To Teach Probability And Graphing
Students engage in the use of technology to investigate the mathematical concepts of probability and graphing. They use the skills of predicting an outcome to come up with reasonable possibilities. Students also practice using a...
Curated OER
Graphing Data
Students graph lines in a coordinate plane. In this geometry instructional activity, students graph lines on a coordinate plane, and identify the slope. They calculate the volume, area and perimeters of the shapes created on a coordinate...
Curated OER
Surveys and Graphing
First graders survey different classrooms to determine types of products students would like to see sold at school, and create graphs based on survey results.
Curated OER
Graphing Candy-Coated Chocolates
Students place pieces of candy on their coordinate graphs as the teacher calls out the colors and coordinates embedded in the plan. The teacher circulates around the class to check each student's answers for accuracy.


