Curated OER
Graphing Data on Ellis Island
Third graders use data to make a bar graph. In this graphing and social studies lesson, 3rd graders use data about where Ellis Island immigrants came from to complete a bar graph on Microsoft Excel.
Curated OER
Where Do I Fit on the Graph?
Students collect data and create graphs about themselves, their community, and the world around them. They use a variety of methods to organize data, such as stickers, clothespins, name tags, coloring, tally marks, etc.
Curated OER
Excel temperature Graphs
Students gather data about the weather in Nome, Alaska. For this Nome Temperature lesson, students create an excel graph to explore the weather trends in Nome. Students will find the average weather and add a trend line to their...
Curated OER
Using Excel To Teach Probability And Graphing
Students engage in the use of technology to investigate the mathematical concepts of probability and graphing. They use the skills of predicting an outcome to come up with reasonable possibilities. Students also practice using a...
Curated OER
Graphing Data
Young scholars graph lines in a coordinate plane. In this geometry lesson plan, students graph lines on a coordinate plane, and identify the slope. They calculate the volume, area and perimeters of the shapes created on a coordinate plane.
Curated OER
Surveys and Graphing
First graders survey different classrooms to determine types of products students would like to see sold at school, and create graphs based on survey results.
Curated OER
Graphing Candy-Coated Chocolates
Students place pieces of candy on their coordinate graphs as the teacher calls out the colors and coordinates embedded in the plan. The teacher circulates around the class to check each student's answers for accuracy.
Curated OER
Groups Coming to America
Fifth graders use text or other references to locate different types of information about the Mayflower and pilgrims. They create a presentation for lower elementary classes about the Pilgrims.
Curated OER
Force and Gliders
Students explore physics by creating data graphs in class. In this flight properties lesson, students read the book Flying Machine and identify the force, resistance and construction necessary to keep a glider in the air. Students...
Curated OER
Apple Graphing
Students sample a variety of types of apples and then survey each other regarding their favorites. They chart how many students prefer each type of apple.
Curated OER
Foliage Tracker
Young scholars discuss the change of leaf colors and the role that climate and elevation play in those changes. They then track leaf changes, input data, and graph foliage changes with a free online tool.
Curated OER
Statistics and Probablility
Statistics and Probability are all about collecting, organizing, and interpreting data. Young learners use previously collected data and construct a picture graph of the data on poster board. This stellar lesson should lead to...
K12 Reader
Displaying Data
It's important to learn how to display data to make the information easier for people to understand. A reading activity prompts kids to use context clues to answer five comprehension questions after reading several paragraphs about...
Center for Math and Science Education
Solar System Launch
Trying to understand the vastness of outer space can be quite a challenge for young scientists. Help put things in perspective with this cross-curricular activity as students work in pairs creating scaled models of...
Curated OER
Graphing Surveys
Students collect data and graph it. In this algebra instructional activity, students create a survey for their classmates and teachers. They analyze the results from the survey and graph it. They draw conclusion from their data based on...
Curated OER
What's Playing Tonight?
Students collect data and visually represent it. They conduct a survey of favorite movies. Using a spreadsheet, students organize the data and create bar and circle graphs. Students answer statistical questions regarding the data.
Curated OER
Get Ready For Some Football
Sixth graders compare and contrast the totals from two national football teams for the year. Using the internet, they search for the information they need and create a data bar graph. They use the information they collected to answer...
Curated OER
How Many?
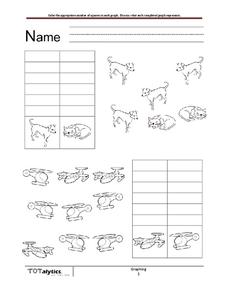
How many cats are there? Dogs? As learners examine a set of images, they fill in a chart to indicate how many of each image there are. In the first series, there are four dogs and two cats. In the second, there are three planes and six...
Curated OER
Line Graphs
Seventh graders create a line graph and identify when to use line graphs. In this line graphs lesson, 7th graders analyze the average temperatures of various cities. Students graph the data they collected.
Curated OER
Using Averages to Create Graphs Through Excel
Sixth graders create and use a spreadsheet to make graphs which will be used to analyze Progress Report and Final Report Card grades. They practice finding the mean, median, mode, and range of a data set. Students also incorporate column...
Curated OER
Getting Graphs: Researching Genealogy-A Piece of Pie
Third graders research their genealogy. In this math lesson, 3rd graders collect data and create graphs and charts. A presentation of their findings is given.
Curated OER
Favorite Food Graph (Blank)
In this math instructional activity, students create a bar graph to display the results of "your Favorite Food Survey." The graph is not labeled but has spaces for all the choices.
Curated OER
What's The Weather?
Second graders record and summarize daily weather observations for a week in the form of a bar graph. They cut and glue a weather symbol for each day, record it on the graph, and answer discussion questions.
Curated OER
Interpreting Medical Data
Students explore human anatomy by graphing scientific data. In this vision lesson, students discuss how ophthalmology works and take their own eye assessment test using the Snellen chart. Students collect vision data from all of their...


