Education.com
Measure School Supplies
Ever wonder how long a pair of scissors are? Find out with this simple measuring activity in which pupils use the provided ruler to determine the length of four common classroom supplies.
Concord Consortium
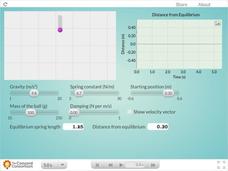
Spring and Mass
Here's a resource with more bounce for the ounce! Engage your physical science class with an interesting interactive that allows individuals to perform tests with a mass attached to a spring. Participants can customize the scenario by...
Chemistry Collective
Chemical Potential: Staircase Demonstration
It's all uphill from here! Scholars examine the pattern of random particle motion up a staircase. The simulation shows how the linear increase in energy corresponds to an exponential decrease in particle concentration.
Math Drills
Valentine's Day Ordering and Comparing (A)
Youngsters use a data table to answer questions, in a Valentine's Day-themed worksheet.
UAF Geophysical Institute
Carbon Footprint
Your young environmentalists can calculate their carbon footprint and discuss ways to reduce it with a worksheet about climate change. After reading a handout about what impact one's carbon footprint can have on the environment, kids...
Curated OER
Graphing With Second Graders
Second graders sort M & M's and then enter the data into a spreadsheet in order to create a simple graph. After printing the spreadsheet generated graph, have students compare the printed graph with their paper graph.
Curated OER
Delicious Graphing
Fourth graders sort trail mix by type and use that information to create different types of graphs for comparing.
Curated OER
Graphing
Fifth graders create graphs based on climate in South Carolina. They read and interpret information in a chart and construct a graphy from the information in the chart. They create a spreadsheet using Excel and publish 2 graphs.
Curated OER
Studies of the Eastern Worlds: Population Graphing
Seventh graders participate in several learning/research stations in which they view artwork from various countries of the Eastern world and collect information on the populations of the Eastern countries. They then use this information...
Curated OER
Graphing Inertia: An Oxymoron?
Eighth graders investigate Newton's Law of Inertia in order to create a context for the review of the use of different types of graphs. They practice gathering the data from an experiment and put it into the correct corresponding graph.
Curated OER
Graphing a Healthy Lifestyle
Fifth graders record the amount of time they spend sleeping, attending school, watching T.V., exercising and doing homework. At the end of the week they graph all of their information and discuss how sleep impacts their learning....
Curated OER
Data Days
Sixth graders practice collecting, organizing and displaying data. They create circle, bar, line and picto graphs. They analyze data in small and large sample groups.
Curated OER
Chart/Graph
Students create a class survey, place the data in a spreadsheet and graph the information.
Curated OER
Tally Time
Students create a tally chart. In this math and health activity, students discuss healthy foods and create a tally chart showing the number of students who like to eat healthy foods.
Curated OER
The Dog Days of Data
Students are introduced to the organization of data This activity is designed using stem and leaf plots. After gather data, they create a visual representation of their data through the use of a stem and leaf plot. Students
drawing...
Curated OER
Do Not Open Until May 2000!
Students create a time capsule. In this time capsule lesson, students collect and record data about themselves to be stored in a time capsule that will be opened at the end of the year.
Curated OER
Halloween Graphitti
Students complete multi-curricular activities in a Halloween themed lesson. In this Halloween lesson, students examine newspaper ads to find prices of pumpkins and use them to complete a stem and leaf plot. Students find the diameter,...
Curated OER
Decode Word Is..
Students solve problems using patterns. In this algebra lesson, students identify the relation, domain and range of a function. They graph functions using coordinate pairs.
Curated OER
Tally Chart Practice
In this tally chart worksheet, students will read about tally charts and their uses. Students will make a list of when and why they could make a tally chart. Next students will complete a tally chart and write statements about the...
Curated OER
Grid Paper
In this math worksheet, students create a bar graph using a ten by ten grid paper. Students can also create shapes using the grid paper.
Curated OER
Environmental Risk Analysis
Young scholars complete a survey and enter the responses in a spreadsheet. The spread sheet is used to create a bar graph. Students complete spreadsheets listing types of hazards in their community.
Curated OER
Birthday Moon
In this science worksheet, students describe and draw what the moon looks like in four phases. Students also research about what the phase of the moon was like on the day and year they were born. Students ask their classmates and...
Curated OER
Excel Lesson
Fifth graders will perform exercises and write the number of each exercise performed on the collection data sheet. They survey eight of their classmates for their exercise data and write that data on the collection data sheet. They then...
Curated OER
Excel Lesson Plan Coin Statistics
Second graders determine the difference between making a prediction and determining actual information. They design a spreadsheet for a coin flipping activity on which they include their predictions and what actual happens when they flip...


