Curated OER
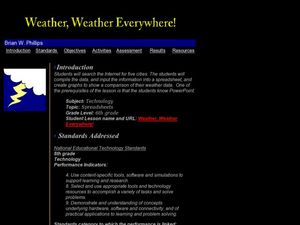
Weather, Weather, Everywhere!
Sixth graders collect weather data to compare temperatures around the world. Using the Internet, learners collect data, put it into spreadsheets, and analyze and graph the results. An interesting way to cover the topic of weather.
Curated OER
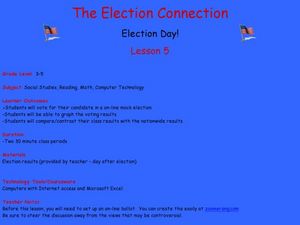
The Election Connection
Students participate in a mock election. In this election lesson, students vote online in a mock election, graph the results, and compare their results to the nationwide results.
Curated OER
Mmm, Mmm, M&M's
Here is another version of the classic M&M math lesson. In this one, upper graders utilize the ClarisWorks Spreadsheet program in order to document the data they come up with from their bags of M&M's. After making their initial...
Curated OER
A Fishy Tale
Eighth graders do a research project on a particular species of Atlantic seafood and record and graph information pertaining to commercial landings of that species of seafood. They use a website and an Appleworks spreadsheet.
Made by Educators
Sociological Methods
First year undergraduate sociology students can prepare for their exams with an application that provides practice questions in six categories: Quantitative and Qualitative Data, Sources of Data, Primary and Secondary Data, Positivism...
Curated OER
Getting to Know Your Student
Include your learners' parents in the back-to-school process with a straightforward worksheet. They write about their child's favorite activities, favorite parts of school, and what they like to be called.
Curated OER
Collecting Data and Graphing
Eighth graders, in groups, count the different colors of M&M's in each kind of package and then draw a pictograph to show the results. Each group writes a program to show their results and then compare the manually-drawn and computer...
Curated OER
Great Graphs
Young scholars create graphs by tabulating their preferences among 10 state quarters. They examine quarters and tally their favorites. They complete a worksheet. There are more lesson plans included in this unit.
Curated OER
Snowfall Statistics for Snowboarding
Students use the Internet to collect the current daily snowfall amounts and also to find the price of a lift ticket for snowboarding at different ski resorts in the United States.
Curated OER
Favorite Survey
Fourth graders collect and organize data for charts and bar graphs by questioning their classmates. They utilize a worksheet imbedded in this plan which guides them through their 'favorites' survey.
Curated OER
How Tall Are We?
Students in a Kindergarten class measure each other's height using large building blocks and then visit a 2nd and a 4th grade class to measure those students. They display the results in bar graphs, comparing the different age groups.
Curated OER
The Great Turkey Walk
Young scholars formulate questions that can be addressed with data and collect, organize, and display relevant data to answer them. They wcreate bar graphs and pie graphs
Curated OER
A Tasty Experiment
Students work together to determine if smell is important to being able to recongize food by taste. They try different foods with different textures and hold their nose. They create a graph of their results.
Curated OER
After the Garbage Can: Where Does Our Trash Go?
Students explore how waste disposal has changed over time and what the current issues are. In this disposal instructional activity students collect data and create graphs.
Curated OER
Mars Landing Site
Students, through the use of candy bars at room temperature, explore the problems selecting a landing site on Mars.
Curated OER
Growing a Seed
Seeing how seeds grow into plants is such an enjoyable for students! They plant lima bean seeds and take pictures to record the growth of their plants. Students write in a journal to describe their daily observations of their plants, and...
Curated OER
The Price is Right
Students, through various activities, explore online databases. Using the internet, students explore the distributors websites. They collect specific information on selected products. An spreadsheet with price comparisons is developed....
Curated OER
Scientific Method and Graphing
Seventh graders use the scientific method to determine how many seeds are in a watermelon.
Curated OER
The Great Chile Challenge
Fifth graders gather data, create a graph, and interpret information. They build vocabulary by negotiating the ideas that go into the graphs which they create. They use Excel to print a variety of graphs based on how much they like Chile...
Curated OER
The Weather and Recess #157
Students track the daily weather at recess time for a number of weeks. They design a bar graph of the different types of weather. They discuss how weather changes affect recess time. They write a list of optional recess activities for...
Curated OER
Where We Live
Young scholars become aware of the different homes in which people may live. They create a simple bar graph to compare the dwellings of their classmates. Students draw pictures of their own home and describe the details of the home to be...
Curated OER
Parts of a Whole
Fourth graders explore fractions through the analysis of various paintings. They view and discuss paintings by Picasso and Seurat, discuss the fractional examples in the paintings, and create a bar graph.
Curated OER
Mira
Learners respond to different color words in English. Using a paper cut-out of a t-shirt, they color the paper their favorite color. After they are finished, they place the picture into a bar graph on the board. They answer questions...
Curated OER
What's Your Favorite Stuffed Animal?
Second graders gather information in a survey and interpret the results using a tally chart, a table, and a bar graph. They' present their results of the during the final group discussion. The subject of the survey is favorite stuffed...


