Curated OER
The Foods we Eat (Los Alimentos)
Sixth graders sing a song and create flashcards showing their favorite foods. In this Spanish "What do you like? lesson, 6th graders display Spanish foods using a document camera and graph their favorites.
Curated OER
When Dinosaurs Ruled the World
Students graph the varying sizes of dinosaurs. In this math and dinosaur lesson plan, students view dinosaur models and compare the different shapes and sizes of the dinosaurs. Students complete a dinosaur math activity, read...
Curated OER
Energy Efficient Buildings
Seventh graders create plans for an energy efficient addition to the school. They work in small groups with each group having responsibility for examining one aspect of the problem. They create working diagrams and a model of their...
Curated OER
December Celebrations
Students study customs of various winter holidays. In this holiday lesson, students read the book The Reasons for the Seasons and complete a winter glyph. Students use graphing software to create a chart of the holidays that are celebrated.
Curated OER
Probabilities for Number Cubes
Students explore the concept of probability. In this probability instructional activity, students roll a six-sided number cube and record the frequency of each outcome. Students graph their data using a frequency chart and...
Curated OER
T-Shirt Lettering
Students determine the cost of a t-shirt using a variety of mathematical operations to solve problems. Then they use a spreadsheet to calculate the cost of lettering a t-shirt and display this information in a graph.
Curated OER
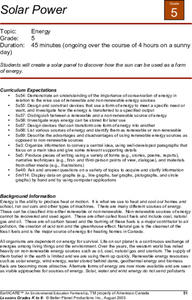
Solar Power
Fifth graders create their own solar panel. They use this experiment to see how the sun can be used as a form of energy.
Curated OER
Where the Buffalo Roam
Students lear about energy, energy efficiency and consumption. They measure energy use, graph the date, write a letter then design and present a PowerPoint on the topic.
Curated OER
Snack Attack
Students design charts, tables, graphs, and pictographs to analyse the types of snacks in a bag.
Curated OER
Collect Data Using a Transect Line
Learners learn about transect lines through a study of marine debris. In this marine debris instructional activity, students calculate the items on a transect line and graph them. Learners complete a category worksheet.
Curated OER
How Has Math Evolved?
Eighth graders pick a topic or person to research related to the history of mathematics. They brainstorm and create a concept map, using the multimedia software inspiration, about what they are researching and want to examine. They then...
Curated OER
Paper Dart Airplane
Students create a paper dart airplane and measure its flight pattern. In this flight lesson, students follow the included directions to build their own paper airplane. The students change the aileron configurations to see how it affects...
Curated OER
What Would Make Our School More "Green"?
Students survey their school to get ideas for how to make the school more environmentally friendly. In this environmental lesson, students collect data from other students and teachers. They use the data to create graphs and present a...
Curated OER
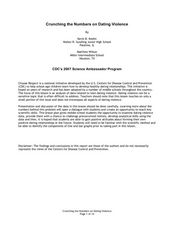
Crunching the Numbers on Dating Violence
Students read about potential violent relationships and beliefs about dating. For this relationship lesson students use graphs to examine data about healthy realtionshipsand draw conclusions on their results.
Curated OER
Jelly Bean Math
Learners estimate, measure, compute, and create patterns using jelly beans. In small groups, they solve various calculations, place jelly beans into groups, invent a new flavor, create a pattern, and complete a worksheet.
Curated OER
TE Activity: Oil Spill Cleanup
Students experiment by creating an oil spill and trying a number of clean up methods. They determine which methods are the least costly and most effective. They role play as an environmental engineer and as an oil company owner who must...
Curated OER
Food Pyramid Power: Looking Back and Moving Forward
Students show their knowledge of properties of objects as it pertains to sorting and creating patterns. In this food pyramid power lesson, students show their ability to use whole numbers in different representations by appling...
Curated OER
The Write Stuff
Fourth graders share a previously written portfolio piece and the class guesses the genre. Students use tally marks to keep track of how many of each piece there are in class. Once the data collection is complete, 4th graders create a...
Curated OER
On Our Way to School
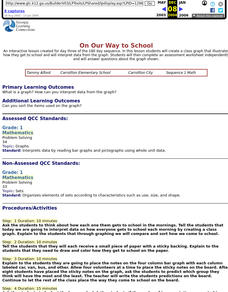
First graders create a class graph that illustrates how they get to school and interpret data from the graph. They complete an assessment worksheet independently and answer questions about the graph shown.
Curated OER
Ratios
Fourth graders complete a taste test of different sandwiches, rate them, and then put them in a ratio graph. In this ratio lesson plan, 4th graders write what they learned about ratios after this activity.
Curated OER
Displaying the Data
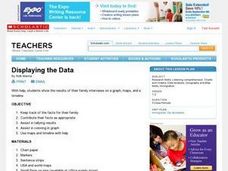
Students gather facts about their parent's families through the completion of parent interview forms. Using tally marks, the data gathered is counted, transferred to graphs and used to create family timelines.
Curated OER
What's The Teacher's Choice?
Fifth graders explore how to use data and display it using a chart or graph. They use food choices for categories and then gather the data and use the provided chart for display. In small groups students discuss the data and the results.
Curated OER
Data Shuffle
Students find an advertisement or newspaper using charts or graphs. They create another graph using the same information in a different format. They write a comparison of the two graphs.
Curated OER
Amphipods
Students identify organisms that live at the bottom of the body of water. In this biology lesson, students evaluate the effects of pollution to amphipods population. They examine collected data and create a bar graph comparing them.


