Curated OER
Graphs to Represent a Data Set
Here are the number of animals Jackson saw at the zoo; scholars organize data into bar graphs using this worksheet. Encourage labeling, but consider having scholars do these on another sheet because there isn't room for the x-axis to be...
Balanced Assessment
Movie Survey
Movie preferences will get your classes talking! Individuals read a pie graph and construct a bar graph using the same information. They then answer questions specific to the data and sample size.
David Pleacher
Candy Math Fun
Few things can motivate children to learn like the promise of a sweet and tasty treat. Given a bag of M&M®s, Skittles®, or other colorful candy, students first predict the contents of the bag before counting the pieces,...
Curated OER
Conversation Heart Graphing
Sixth graders review the different types of graphs (bar, line, pictograph) They predict the data set they can garner several boxes of conversation hearts. Students record their data using an Excel spreadsheet. They create a graph based...
Curated OER
Bar Graph Lesson
Students make a bar graph. In this graphing lesson, students discuss why bar graphs are used and are shown bar graph examples. Students create their own bar graph to compare the heights of different things around the world. Students...
Curated OER
Bar Graph- Calories In Fast Food Items
In this bar graph worksheet, students analyze a bar graph that shows calories in 10 fast food menu items. Students answer 7 questions about the graph.
Curated OER
Choose an Appropriate Graph
In this graphs learning exercise, students solve 6 fill in the blank problems where they choose the most appropriate type of graph for each set of data and explain why they chose that type. Students use bar graphs, histograms and circle...
Curated OER
Perplexing Puzzles
Elementary and middle schoolers explore scatter plots. In this graphing lesson, pupils work in small groups and use jigsaw puzzles to develop a scatter plot. Younger students may develop a bar graph.
Curated OER
Favorite Candy Bar Graph
Students decide on six different types of candy bars to include in a data collection activity. Working in small groups, they survey a target group in a set amount of time. They access a Internet based graphing tool to create a bar graph...
Curated OER
Simple Bar Graphs Using Excel
Young scholars create original survey questions, and develop a bar graph of the data on paper. They input the survey data using two variables onto an Excel bar graph spreadsheet.
Curated OER
Temperature Bar Graph
Students explore mean, median and mode. In this math lesson, students analyze temperature data and figure the mean, median, and mode of the data. Students graph the data in a bar graph.
Curated OER
Easter Bar Graph- A
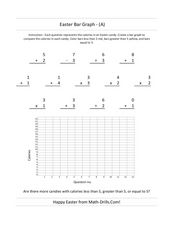
In this Easter math worksheet, students first solve 13 problems with addition, subtraction, multiplication and division. Using the answers, students make a bar graph.
Curated OER
Easter Bar Graph - C
In this math review worksheet, students complete addition, multiplication, division, and subtraction problems where each answer is inserted into a bar graph. Students complete 13 problems.
Curated OER
Easter Bar Graph - (E)
In this math review instructional activity, students complete addition, multiplication, division, and subtraction problems where each answer is put into an Easter bar graph. Students complete 13 problems.
Curated OER
Easter Bar Graph - (B)
In this math review learning exercise, students complete addition, subtraction, multiplication, and division problems and put their answers into a bar graph that represents calories. Students complete 13 problems and 1 graph.
Curated OER
Easter Bar Graph - (D)
In this math review activity, students complete addition, multiplication, division, and subtraction problems where each answer is put into an Easter bar graph. Students complete 13 problems.
Curated OER
Histograms and Bar Graphs
Learners are introduced to histograms, bar graphs, and the concept of class interval. They use an activity and three discussions with supplemental exercises to help students explore how data can be graphically represented (and...
Curated OER
Bar Charts and Pictographs: How can they help us?
First graders work with manipulatives to solve various math problems by using concrete objects to solve a list of problems . They create and evaluate bar graphs and write a statement about the information on their bar graph.
Curated OER
Create a Bar Graph
In this bar graph activity, students use a set of clues about favorite types of books to draw the bars on a graph. Answers are included on page 2.
Curated OER
Graphing in the Form of Bar Graphs
Young scholars explore bar graphs. In this math lesson, students create and conduct a survey. Young scholars graph their data in a bar graph.
Curated OER
Activity: Make a Bar Graph
In this bar graph activity, students use a given picture to create a graph, then use the graph to solve 2 related problems. Graph is sports related.
National Security Agency
Starting a Restaurant
Through an engaging unit, chefs-in-training will sort and classify data using tally charts. Learners will also create bar graphs to display restaurant data and interpret data from bar graphs using a variety of categories....
Curated OER
Favorite And Least Favorite Vegetable Survey and Bar Graph
In this favorite and least favorite vegetable survey, students create a bar graph after they survey and keep track of data on this graphic organizer.


