CK-12 Foundation
Frequency Tables to Organize and Display Data: Favorite Films
What information can your class determine if they know the number of people attending movie showings? Using the information about the number of people at each screening, learners develop a frequency table. The pupils analyze the type of...
Howard Hughes Medical Institute
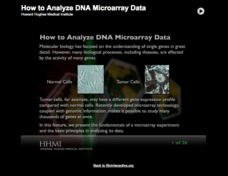
How to Analyze DNA Microarray Data
Unravel the complexities of DNA research. Analyzing DNA data can be a daunting, time-consuming task; however, as the lesson explains, an interactive importance of the research outweighs its complexities. The presentation breaks down the...
CK-12 Foundation
Bar Graphs, Frequency Tables, and Histograms: Comparing Heights
Become a master at creating visual displays. Using a provided list of heights, users of the interactive create a bar graph and a histogram. They answer a set of challenge questions based on these data representations.
CK-12 Foundation
Understand and Create Histograms: Histograms
Tally ho! Represent the frequency of ages at school. Pupils finish a tally chart to match the frequencies of ages at school. Using the frequencies, the learners create a histogram. With the aid of the histogram and the frequency table,...
Shodor Education Foundation
Regression
How good is the fit? Using an interactive, classmates create a scatter plot of bivariate data and fit their own lines of best fit. The applet allows pupils to display the regression line along with the correlation coefficient. As a final...
CK-12 Foundation
Line Plots from Frequency Tables: Sleep Cycles
Demonstrate the ease of using a frequency table. An interactive lesson allows learners to create a frequency table efficiently. Challenge questions ask your classes to analyze the data represented in the frequency table.
Magic of Physics
Shadows
Sunrise, sunset ... swiftly move the shadows! Pupils practice comparing shadow length data with a hands-on activity. The resource allows users to examine and measure the shadow cast by a stick as the sun moves overhead before testing...
Curated OER
Adopt a City-Winter Weather
In weather worksheet, students use an on line site to collect weather data. They create 10 different weather scenarios using a temperature and humidity slider. They includethe temperature, relative humidity and weather conditions and...
Royal Society of Chemistry
Shapes of Molecules—Hybrid Orbitals
Take your chemistry class' knowledge of molecular geometry to the next level! Introduce orbital hybridization with a series of related games. Individuals complete a data table in the first activity, then solve Sudoku-like puzzles using...
Shodor Education Foundation
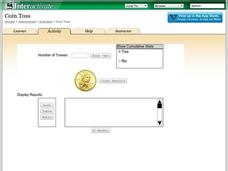
Coin Toss
Are your young mathematicians having a hard time making heads or tails of probabilities? It's no toss up—here is a resource that's sure to straighten them out! Learners run the interactive to toss a coin a different number of times....
CK-12 Foundation
Frequency Polygons: Constructing a Frequency Polygon
Connect the dots on frequency. Given a distribution table of scores on an assessment, learners create a frequency polygon by moving points on a graph to the correct frequency. The pupils use the display to answer questions about the...
CK-12 Foundation
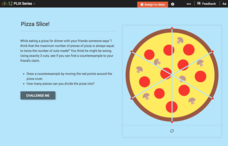
Using Quadratic Equations to Solve Problems: Pizza Slice!
Get the most out of a pizza. Class members use an interactive to simulate cutting a pizza to determine the maximum number of slices possible. The pupils create a set of data points and determine the equation that models the relationship.
Desmos
Desmos Graphing Calculator
They say a graph is worth a thousand points. The interactive allows users to graph a wide variety of functions and equations. Using the included keyboard or typing directly into the list, learners determine the graph of a function....
Curated OER
Birds of Wetlands Facts Table Activity
In this birds of wetlands worksheet, students create a table on the internet to insert facts of the birds in the wetlands. Students make a table for 9 birds.
Curated OER
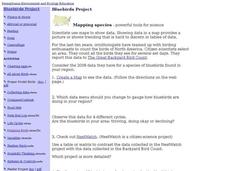
Bluebirds Project: Mapping Species
In this bluebirds project: mapping species worksheet, students create a map based on data for bluebirds in their area, then answer 5 questions about the mapping of the species. This page has numerous links to helpful web...
Curated OER
Elbow Room - Exploring Population Density
In this population worksheet, students click on the links and research the internet about population, land, and government. Students answer 16 short answer questions including making spreadsheets.
Curated OER
Anatomy of an Earthquake
In this earthquake activity, students read and study earthquake maps and statistics. They complete 8 short answer questions that follow.
National Council of Teachers of Mathematics
Nctm: Illuminations: Histogram Tool
This tool can be used to create a histogram for analyzing the distribution of a data set using data that you enter or using pre-loaded data that you select.
US Department of Education
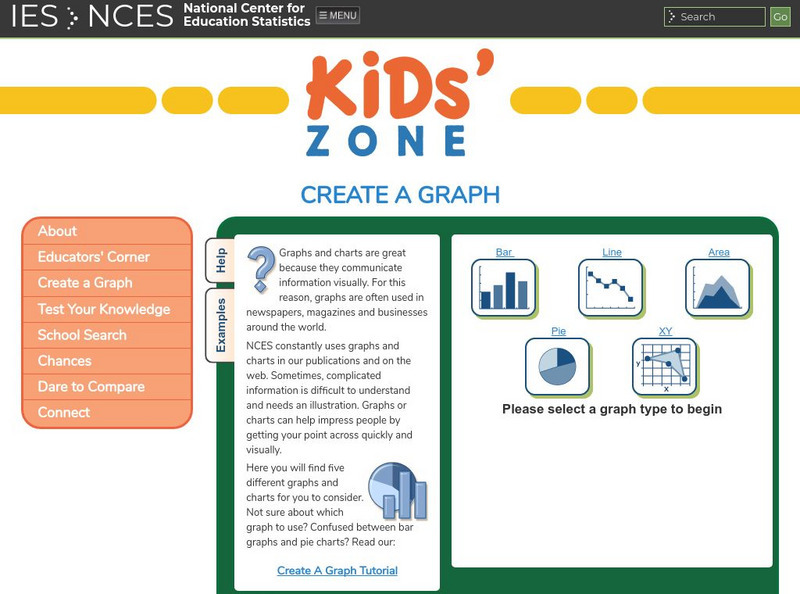
Nces Kids: Create an Xy Graph
This is where you can find a step by step explanation of how to create an XY graph. When you finish each step just click the next tab and you will find the next set of instructions.
US Department of Education
Nces Kids: Creating an Area Graph
This is where you will find step by step directions explaining how to create an area graph. Complete each step and click on the next tab. Directions are simple and clear.
Annenberg Foundation
Annenberg Learner: The Habitable Planet: Ecology Lab
Create the parameters of your own ecosystem by choosing which producers and consumers live there. Visualize how the food web operates and species populations change. This simulator mimics the food web within a typical ecosystem and gives...

