Curated OER
Where Did the Bunny Leave the Eggs? Picture Graphing Activity
The Easter Bunny left us a bunch of eggs, but how many did he leave? Learners use the data to create a picture graph, interpret it, and answer the questions that follow. There's even easy egg cut-outs for your youngsters!
Museum of Tolerance
Where Do Our Families Come From?
After a grand conversation about immigration to the United States, scholars interview a family member to learn about their journey to America. They then take their new-found knowledge and apply their findings to tracking their family...
Curated OER
Remembering Our Veterans
Eighth graders research a variety of military statistics while using the theme of Remebering Our Veterans. They use data management to plan and create a PowerPoint presentation with their findings. They incorporate different types of...
Curated OER
Canada at a Glance
Stjudents examine the statistics in a Canadian publication for use in graphs. They develop their own questions based on tables and graphs found in this publication..
Curated OER
Surname Survey
Students use data from the U.S. Census Bureau to determine whether last names in a local phone directory reflect the Census Bureau's list of the most common surnames in the country. In this surnames lesson plan, students use the Internet...
Math Drills
Valentine's Day Ordering and Comparing (A)
Youngsters use a data table to answer questions, in a Valentine's Day-themed learning exercise.
Curated OER
Twelve Days of Christmas--Prediction, Estimation, Addition, Table and Chart
Scholars explore graphing. They will listen to and sing "The Twelve Days of Christmas" and estimate how many gifts were mentioned in the song. Then complete a data chart representing each gift given in the song. They also construct...
Living Rainforest
Finding the Rainforests
From Brazil to Indonesia, young scientists investigate the geography and climate of the world's tropical rain forests with this collection of worksheets.
Curated OER
Meatiest States: Graph Problem Solving
In this graph problem solving worksheet, learners analyze a graph that shows commercial red meat production in five states. Students answer 5 word problems using the data on the graph.
Curated OER
Science and Technology
Students research inventions that have been created. In this historical technology lesson, students read the Harcourt Brace social studies textbook and discuss how inventors used graphs to display data. Students create a table to write...
Curated OER
Historical Population Changes in the US
Students conduct research on historical population changes in the U.S. They conduct Internet research on the Historical Census Data Browser, create a bar graph and data table using a spreadsheet program, and display and interpret their...
Curated OER
200 Years and Counting: How the U.S. Census Tracks Social Trends
Students examine the process of census taking in the United States. In this "200 Years and Counting" lesson, students examine the data collection process, look at an example of a census form, analyze data, and learn what the information...
Curated OER
Immigration Graphs
Fourth graders study immigration. In this graphing lesson, 4th graders make a population graph of people who have immigrated to Indiana.
Curated OER
Graphing Regions: Lesson 2
Young scholars identify and analyze geographical locations of inventors. They each identify where their inventor is from on a U.S. map, discuss geographic patterns, and create a t-chart and graph using the Graph Club 2.0 Software.
Curated OER
Excel temperature Graphs
Students gather data about the weather in Nome, Alaska. In this Nome Temperature lesson, students create an excel graph to explore the weather trends in Nome. Students will find the average weather and add a trend line to their graph.
Curated OER
Green Food Graph
Students explore graph making by investigating St. Patrick's day food. In this holiday food lesson, students discuss their favorite green foods in honor of St. Patrick's day. Students create a graph based on the data of which green foods...
Miami University
Chapter Nine Worksheet: Monopoly
Advanced economics pupils analyze a series of graphs, data sets, and profit scenarios all related to monopolies and marginal revenue. They read through the background information, complete a graph using the data provided, and justify...
Curated OER
Role-Playing Jean Talon
Students explore New France. In this New France instructional activity, students examine census data compiled by Jean Talon in 1665 and 1666. Students take on the role of Talon trying to convince the King of France to increase his...
Curated OER
Pecan Power
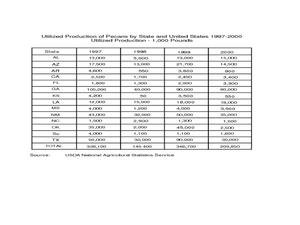
Students study the origins of pecans and complete a bar graph from the data they have discovered. In this pecan lesson plan, students draw pecans, discuss a pecan time line, and draw a bar graph comparing Arizona pecans to other...
Curated OER
A Thanksgiving Survey
Students take a survey then use the information gained from the survey to help plan a typical Thanksgiving dinner for our last day of class. They create a graph which corresponds the the data gathered during interviews.
Curated OER
Effects of chemical use in Agriculture
Students research environmental data to create a bar graph. For this agricultural ecology lesson, students research the pros and cons of chemical use in farming. Students debate on passing a law to reduce chemical use.
Curated OER
From Sea to Shining Sea
Students study the geography of the United States of America. Students write letters, create travel brochures, make maps, graph population numbers, read fiction and nonfiction selections, complete KWL charts, and watch films.
Curated OER
Weather instruments
Students explore weather instruments. In this weather lesson, students make rain gauges, anemometers, and barometers following the instructions given in the lesson. Students set up a weather station using their instruments and record and...
Curated OER
Displaying The Data
Pupils engage in a research project to find information about one's personal family heritage. They collect information by conducting family interviews. Students use the data to create a graph, map, and timeline. Then pupils take part in...


