Curated OER
My Community
First graders design a Powerpoint presentation to reflect information about their community. In this community lesson, 1st graders create slides to explain the weather, geography and other information about the city.
Curated OER
Temperature High and Lows
Young scholars gather high and low temperature readings through email. In this temperature graphing activity, students use a spreadsheet to input data for a graph. young scholars interpret the graphs to compare and contrast the data from...
Curated OER
Excel temperature Graphs
Learners gather data about the weather in Nome, Alaska. In this Nome Temperature lesson, students create an excel graph to explore the weather trends in Nome. Learners will find the average weather and add a trend line to their graph.
Curated OER
Memory Game
Students create cards for a memory game by entering data into a spreadsheet that is then merged into a word processing document. Tutorials are available through links on the lesson page.
Curated OER
Interest Calculation and Spreadsheets
Students, while in the computer lab working on a spreadsheet program, calculate interest and accumulated value of a savings plan. They follow specific directives on how to create their spreadsheets. At the end of the lesson they print...
Curated OER
Using Computers to Produce Spreadsheets and Bar Graphs
Pupils review graphing terminology and how to plot data points, how to input data into a spreadsheet, and how to make a chart using a computer.
Curated OER
Favorite Farm Animals
Students perform a study of farm animals and their babies. They compile a graph of their favorite farm animals. They utilize a spreadsheet worksheet which is imbedded in this plan.
Curated OER
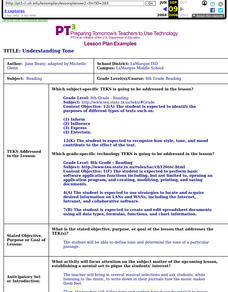
Understanding Tone
Eighth graders define tone and determine the tone of a particular passage making a web of tone words on Inspiration. They write a journal entry expressing how a piece of music makes them feel and create a PowerPoint to share.
Curated OER
Comparing Temperatures in Different Cities
Students generate a spreadsheet to calculate average daily temperature. They create graphs from spreadsheet data and comprehend the components of the a spreadsheet.
Curated OER
Graphing With Second Graders
Second graders sort M & M's and then enter the data into a spreadsheet in order to create a simple graph. After printing the spreadsheet generated graph, have students compare the printed graph with their paper graph.
Curated OER
Twelve Days of Christmas
Learners create charts and graphs using a spreadsheet. They chart the number of each gift given day by day from the song, "The Twelve Days of Christmas." They create a bar graph and a circle graph from their data on the spreadsheet.
Curated OER
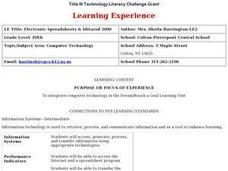
Electronic Spreadsheets & Iditarod 2000
Students use the Internet for gathering information for Iditarod race journals. They use a spreadsheet program for entering data and making charts for showing changes in speeds achieved over a period of four weeks in timed writings in...
Curated OER
Phenomenal Weather-Related Statistics
Eighth graders research, collect and interpret data about weather statistics. They record that data on spreadsheets. they create Powerpoint presentations on their individual or group research.
Curated OER
Our Favorite Pet
Students each have a turn, telling the class his or her favorite pet. The choices are cat, dog, fish or bird. Using the computer, the information from the tally be recorded on a spreadsheet and bar graph.
Curated OER
Space Presents Problems
Students use the internet to research problems related to space. They complete a questionaire to direct their research before beginning. They create a database of moon and planet characteristics.
Curated OER
Chart/Graph
Students create a class survey, place the data in a spreadsheet and graph the information.
Curated OER
Fly Away With Averages
Students study mean, median, and mode. They construct paper airplanes and test them to see how far they fly. They measure the distance and then find the averages of their throws. They use spreadsheet software to record the data in a...
Curated OER
WORKING WITH WORKBOOKS
Learners work through problems in the textbook and teacher-made problems to reinforce the new learning. They turn in practice problems to instructor to be checked for accuracy and evidence of understanding
Curated OER
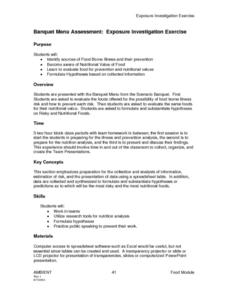
Banquet Menu Assessment: Exposure Investigation Exercise
Learners identify sources of Food Borne illness and their prevention. They formulate hypotheses based on collected information. Pupils become aware of Nutrintional value of food. Students collected data are synthesized to formulate...
Curated OER
How many seeds?
Students investigate seeds and find the difference between seeds and nuts. In this seeds and nuts lesson, students predict, then count the number of seeds in an apple. Students record and share their results. Students compare seeds to...


