CK-12 Foundation
Double Bar Graphs: Favorite Cookies Chart
It's just the way the cookie crumbles. Using the data from a class poll, learners create a double bar graph showing favorite cookie types. The pupils compare favorites between boys and girls with the aid of their graphs, then they make...
Willow Tree
Bar Graphs
Circles, lines, dots, boxes: graphs come in all shapes in sizes. Scholars learn how to make a bar graph using univariate data. They also analyze data using those bar graphs.
World Wildlife Fund
Graphs and Charts
A two-part worksheet incorporating bar graphs and pie charts, young mathematicians can practice their graphing skills. Pupils answer questions using graphs and charts but are also challenged to create their own using a given set of data.
Benjamin Franklin High School
Saxon Math: Algebra 2 (Section 3)
In this third of a twelve-part series, the focus moves from using matrices to solving systems of equations with substitution and elimination, including more than two dimensions and variables in equations, and analyzing statistical data....
Curated OER
Conversation Heart Graphing
Sixth graders review the different types of graphs (bar, line, pictograph) They predict the data set they can garner several boxes of conversation hearts. Students record their data using an Excel spreadsheet. They create a graph based...
West Contra Costa Unified School District
Graph Square Root and Cube Root Functions
Scholars first learn to graph square root and cube root functions by creating a table of values. They then learn how to graph functions from transformation of the graphs of the parent square root and cube root functions.
CK-12 Foundation
Graphs of Systems of Linear Inequalities in Two Variables: President Jefferson's Octagonal Home
Mathematically complete a set of blueprints. Using eight linear inequalities, pupils create a blueprint of Thomas Jefferson's home. Individuals graph the linear inequalities and position the solution of the inequalities before...
Concord Consortium
Graphing Elements
How do you graph a sentence? Scholars do just that as they represent relationships between independent and dependent variables with a graphical representation. Given a sentence, they determine the pertinent relationship and create a...
CK-12 Foundation
Broken-Line Graphs: Heating Curve of Water
Examine the unique graphs coined broken-line graphs. Using the phase change of water for data, learners answer questions related to the temperature and energy at different times in the cycle of the phase change. Questions focus on the...
CK-12 Foundation
Single Bar Graphs: Hockey Teams
Raise the bar for hockey fans. Using data about favorite hockey teams, pupils build a bar graph. They use the information from the graph to make comparisons and solve one- and two-step problems.
CK-12 Foundation
Multiple Line Graphs: Jack's Jumpshot
What are the advantages to seeing multiple data sets on the same graph? Scholars explore this question as they manipulate the animation within the lesson. Questions within the interactive ask individuals to make comparisons across the...
CK-12 Foundation
Quadratic Functions and Their Graphs: Soccer Ball Trajectory
Determine critical points in the flight of a soccer ball. Pupils use an interactive resource to find the vertex and x-intercepts of the graph of the trajectory of a soccer ball after being kicked. Scholars investigate the trajectory...
CK-12 Foundation
Graphs of Functions Based on Rules: Plotting Profits
Profit from this interactive on graphing and interpreting functions. An interactive allows learners to plot a square root function representing a company's profits. They answer some challenge questions that require interpreting this...
Savvas Learning
Saxon Math Answer Forms
Tired of hunting through math assignments and assessments trying to find answers? Then this collection of answer forms is just what you need. Providing numbered spaces for students to use when completing worksheets and...
EngageNY
Analyzing a Graph
Collaborative groups utilize their knowledge of parent functions and transformations to determine the equations associated with graphs. The graph is then related to the scenario it represents.
EngageNY
Stretching and Shrinking Graphs of Functions
Why is that graph wider? Pupils learn about stretching and shrinking graphs of square root, absolute value, cubic, and quadratic functions. They study both vertical and horizontal stretches and shrinks in addition to reflections.
Houston Area Calculus Teachers
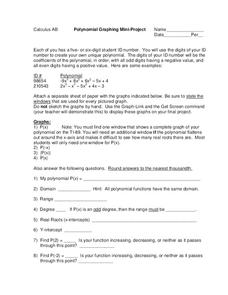
Polynomial Graphing
Your AP Calculus learners probably have their ID numbers memorized, but have they tried graphing them? Pique your pupils' interest by asking each to create a unique polynomial function based on their ID numbers, and then analyze the...
K-5 Math Teaching Resources
Graph Paper
You'll never have to buy graph paper again with this printable resource, which can be used for anything from creating graphs, plotting points in the coordinate plane, or measuring the area and perimeter of polygons. A...
CCSS Math Activities
Smarter Balanced Sample Items: 8th Grade Math – Claim 4
A math model is a good model. A slide show presents 10 sample items on modeling and data analysis. Items from Smarter Balanced illustrate different ways that Claim 4 may be assessed on the 8th grade math assessment. The presentation is...
CCSS Math Activities
Smarter Balanced Sample Items: 8th Grade Math – Target D
Can learners determine solutions associated with lines? A slide presentation contains sample items for the Smarter Balanced 8th grade math Target D covering solving linear equations and systems of linear equations. Items illustrate the...
EngageNY
Modeling a Context from a Graph
Collaborative pairs develop functions that model a graph from a context using the modeling cycle. They then analyze their function models in order to answer questions about the scenario.
Curated OER
A Picture is Worth a Thousand Words: Introduction to Graphing
Students practice graphing activities. In this graphing lesson, students discuss ways to collect data and complete survey activities. Students visit a table and graphs website and then a create a graph website to practice graphing.
Curated OER
Learning to Read Graphs
What is your favorite pet? This is a great tool for youngsters just learning how to read and interpret graphs. There are four simple questions. Consider extending this activity by creating a class bar graph: how many learners have a dog,...
Curated OER
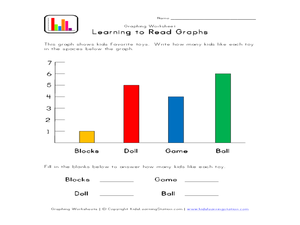
Learning to Read Graphs 2
Do you like playing with blocks, dolls, games, or balls? Use this basic graph to review bar graphs with young learners. After completing the four questions below, consider creating your own class graph: who likes blocks the best? Who...


